Contextual Healing
Ahead of the 2020 Census, Brookings Institute released a new report with six interactive maps that show how the country’s racial demographics have changed using Census Bureau 2018 estimates. The long story short is that the country is now the most diverse it has ever been, with Hispanic and Asian Americans growing the fastest while the white population grew just 0.1% since 2010. Here’s a county-by-county overview of where racial minority groups are highly represented, meaning their share of the county’s population is higher than their share of the nation’s population. If you go to the website, you can hover over each county to see the racial breakdown.
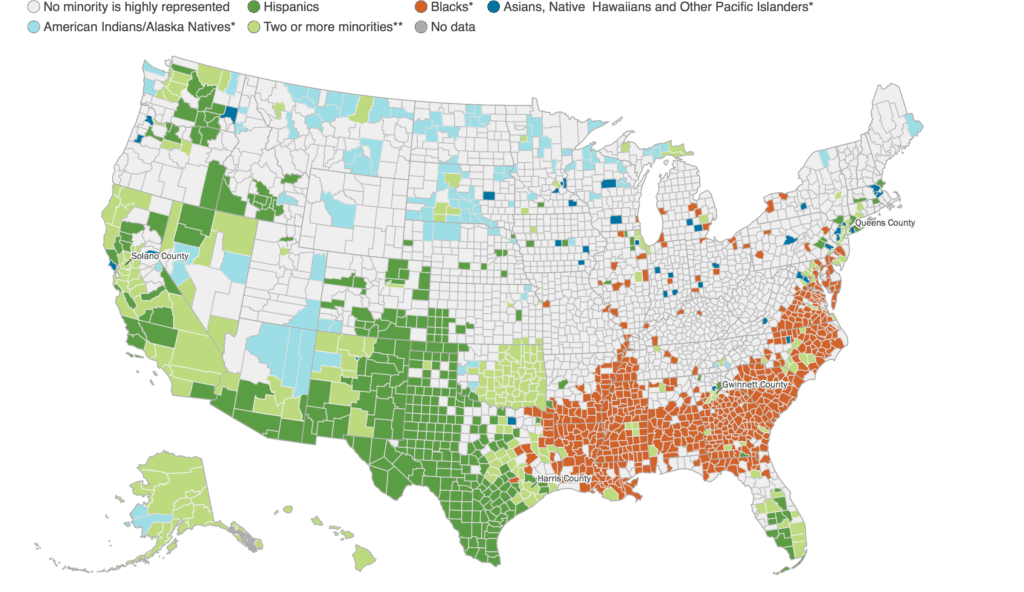
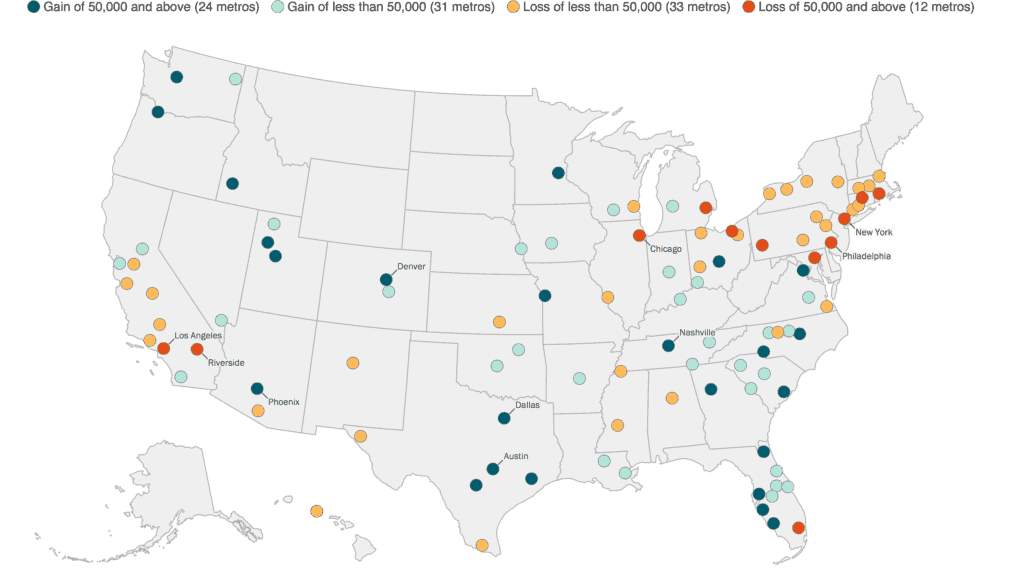
The other five maps show how metropolitan areas are becoming increasingly diverse and where the Asian and Hispanic populations are growing the fastest. The last two maps are particularly relevant for North Carolina. One shows the reversal of the Great Migration, with the black population growing in southern cities and declining in midwestern cities. The last map shows the migration of whites out of the Northeast to the Sunbelt region, including North Carolina.
Food for Thought
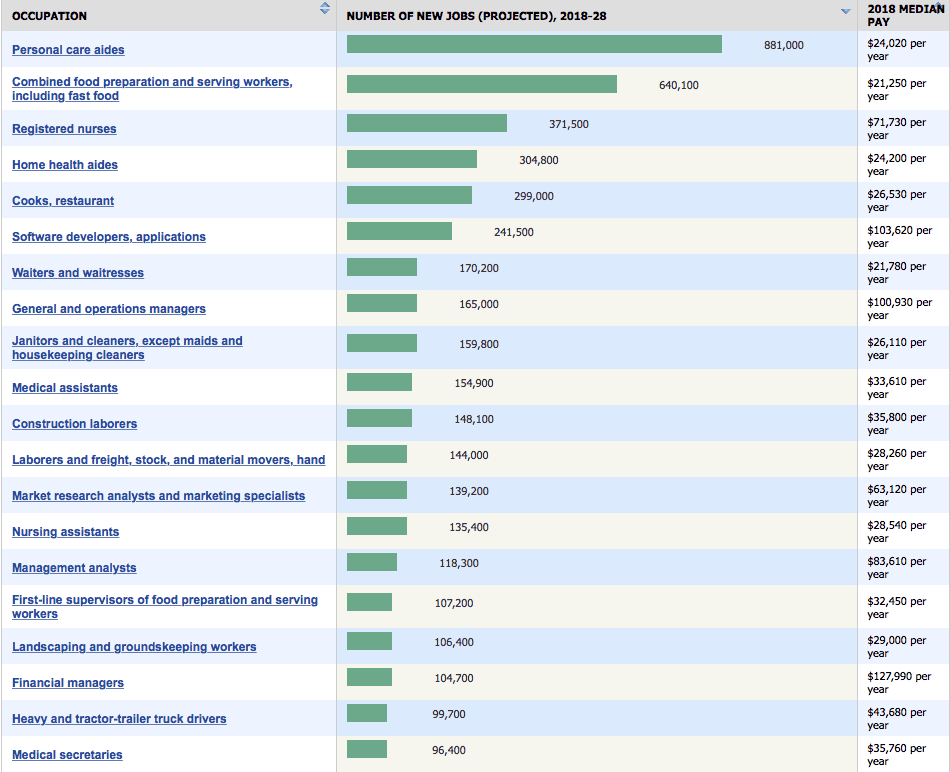
The Bureau of Labor Statistics just released their list of the 20 occupations with the most projected new jobs over the next 10 years along with their median pay. The top two jobs are personal care aides and food preparation/service workers, and the projected number of new jobs in both far outweigh the other 18 jobs. Neither require a bachelor’s degree and both have low median pay ($24,020 and $21,250 per year, respectively). Of the other 18 jobs, only a few require a bachelor’s degree and have median pay above $40,000. See the full list below, and go to the website to read a fuller description of each job, including any degree requirements.
Dropping Knowledge
School segregation in the south is increasing as more white municipalities secede from larger, more diverse districts, according to a new report published by the American Educational Research Assocation. The study looks at seven southern counties that experienced secession since 2000 and found that between-district segregation has increased for black and white students, Hispanic and white students, and Asian and white students.
The seven counties that experienced school district secession were in Alabama, Louisiana, and Tennessee. According to the report, these counties became majority non-White between 2000 and 2014 and had school populations that were more diverse than the region as a whole.
The report also looked at the impact of school secessions on residential segregation and found that while school district boundaries contributed more to residential segregation in recent years (2010-2014), they contributed much less to residential segregation than to school segregation.
What we're reading

A day in Craven County as Dorian approaches
EdNC reporter Rupen Fofaria is on the ground in Craven County covering the preparation and impact of Hurricane Dorian. Follow him on Twitter @Rupen_Fofaria for real-time updates throughout today and the next week. ... Read the rest-
How This Apprenticeship Helps Educators Achieve Once Out-of-Reach Career Goals
-
What kind of future of work will we choose for America’s working families?
-
The Slow Process of Post-Hurricane Housing Recovery
-
Diets Effect on Gut Bacteria
-
Student Debt Is Transforming the American Family
-
Which NC undergraduate degree program graduates have the highest average wages after five years?