After our piece on congressional apportionment two weeks ago, we received a couple of questions about how the census works and why it is important. Asking for that type of explanation is like asking someone in Lexington to explain the advantages of including ketchup in barbecue. (We at the Center maintain strict neutrality matters of politics and barbecue.) Even though it is still two and a half years away, here are four points to consider as the 2020 census approaches.
A deeply historical institution
Though the methods and rationale for counting people have varied, civilizations have been counting their residents for thousands of years. The Babylonians, the Persians, and the Chinese are all known to have collected population statistics. According to the biblical Gospel of Luke, a Roman census was responsible for drawing Mary and Joseph to Bethlehem prior to the birth of Jesus.
In the United States, the first census was taken in 1790, shortly after the inauguration of George Washington. The data for the first six censuses was collected by U.S. Marshals who were required to visit every household. The first census contained six questions. The number of questions peaked in 2000 with 52 and was reduced to a more manageable 10 questions in 2010.
As one of the original colonies, North Carolina was included in the informal counting of populations since the 17th century. In 1700, an informal estimate of the state’s population was 5,000 residents. By 1754, the North Carolina population was estimated to be 90,000. And in 1775, estimates were at 181,000 residents, making North Carolina the sixth most populous colony prior to the American Revolutionary War.
North Carolina has seen steady growth since 1790. Over 23 censuses North Carolina’s population growth rate has averaged 13.4% per decade. In only four decades did the growth rate vary by more than 4 percentage points.
 Source: NCCPPR staff research from U.S. Census Bureau data
Modern Census requires impressive infrastructure
In recent decades, the Census Bureau’s decennial counting effort has been drawn out over four years with the bulk of the work taking place over 30 to 36 months. Regional offices for the 2010 Census began opening in January, 2008 with mapping, recruitment and other preparation work lasting for more than a year. By the Fall 2009, the final recruiting took place for the peak work in 2010. Census forms arrived by mail in March 2010 with the official Census Day occurring on April 1, 2010.
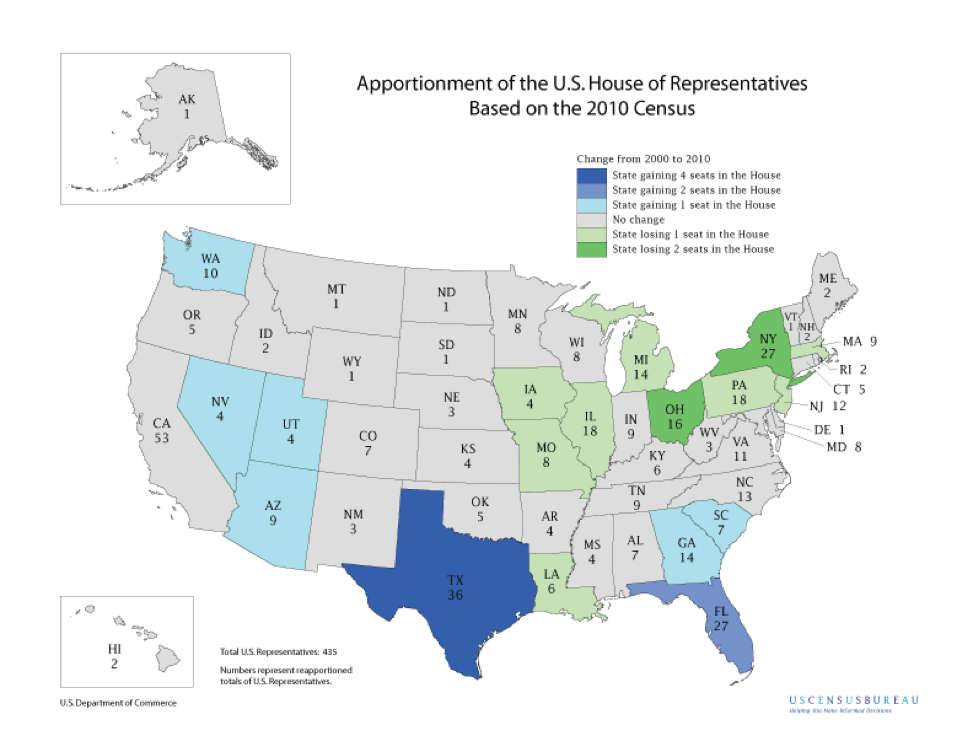
By December 31, 2010, the Census Bureau was required to transmit official state population data to the president who then presented it Congress for the House to disclose the number of seats per state. In 2011, the Census Bureau had until March 31 to deliver the necessary data to the state for redistricting.
Throughout the rest of 2011, the Census Bureau produced other data products based on the official counting. Beginning in 2012, the Bureau then began its off-cycle estimates on a variety of areas including agricultural, economic, and governmental data.
The scope of the census efforts are significant. The 2010 Census effort cost about $12.9 billion which was $1.6 billion under budget. The Census Bureau received mailed responses from 72 percent of households and knocked on 47 million doors. According to the U.S. Commerce Office of the Inspector General, the 2020 Census is expected to cost between $22 and $30 billion.
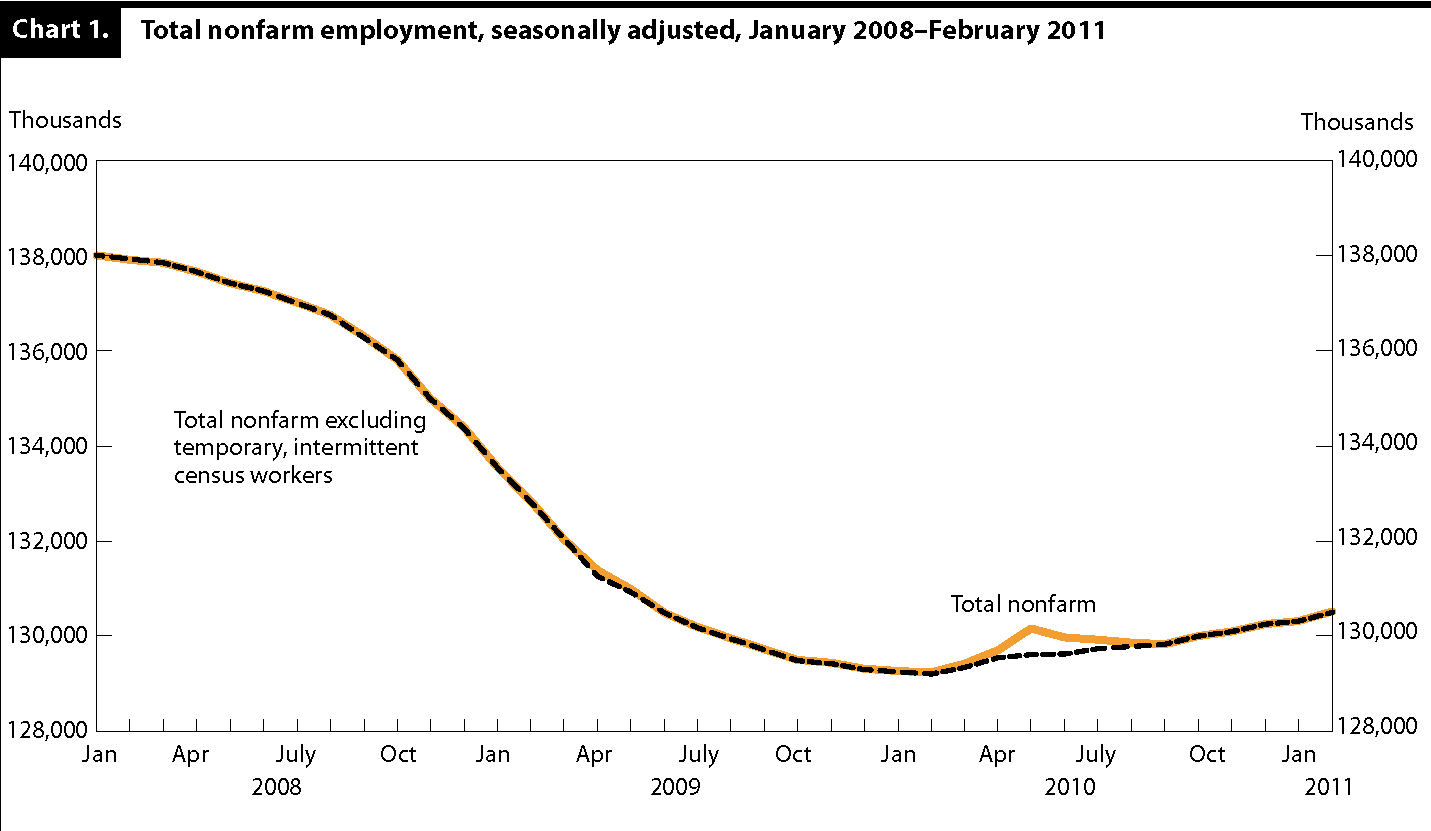
The Bureau employed 635,000 people to work on the 2010 Census with 564,000 of those hired as temporary workers. The census temporary workforce is large enough that the peak hiring creates a noticeable blip on the U.S. employment curve.
 Source: Bureau of Labor Statistics Monthly Labor Review, March 2011, “The 2010 Census: the employment impact of counting the Nation,” https://www.bls.gov/opub/mlr/2011/03/art3full.pdf
Census determines the power balance in our democracy
In 1791, the U.S. Congress consisted of 69 members of the House of Representatives and the U.S. had a population of 3.9 million people.* The average number of people per Member of the House was 56,945.
By 1913, Congress established the current 435-member structure of the House of Representatives. The 1910 Census recorded 92 million people in the U.S. which meant that the average number of people per Member of the House had risen to 212,020. In the 100 years since that time, the U.S. population has more than tripled to 276 million people. As a result, the target number of people per representative is now 709,760.
 Source: U.S. Census Bureau
The exact number of people represented by members of each state’s congressional delegation varies. Montana has one congressional representative and the largest number of people per representative at 989,415. Rhode Island has the smallest number of people per representative at 526,284.
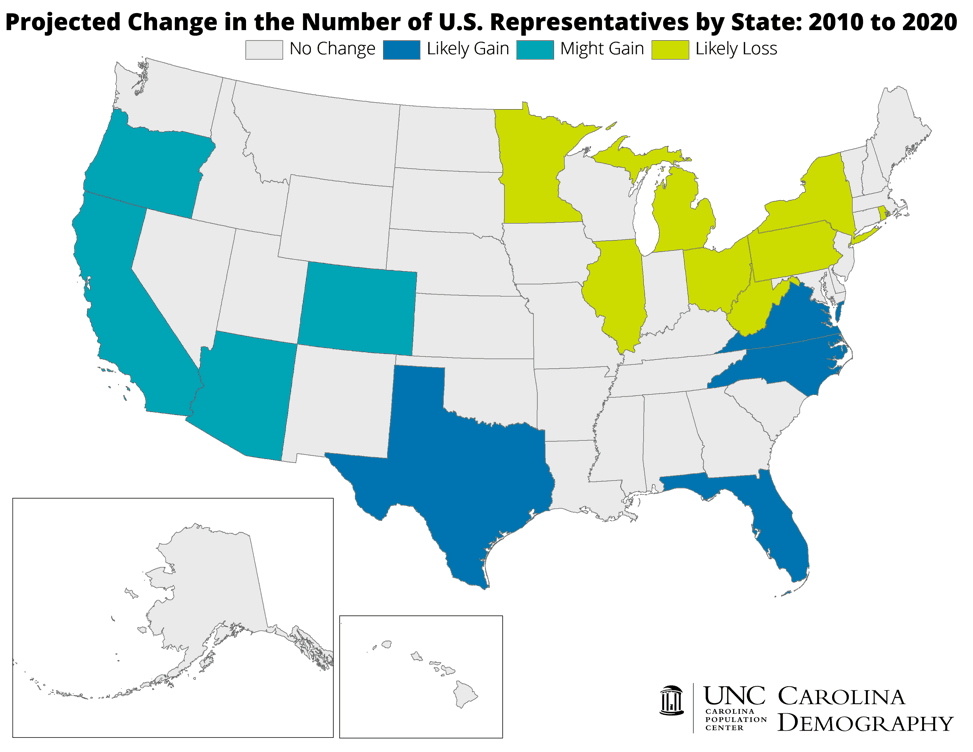
In 2020, the Carolina Population Center projects North Carolina will gain a 14th seat in the U.S. House of Representatives. For a complete overview of the projections, see their 2015 blog post.
 Source: Carolina Population Center at UNC
North Carolina has the 11th most people per representative at 733,499. Since the 1910 Census, North Carolina has fluctuated between having 10 and 13 members of the U.S. House of Representatives. During that time, the number of people represented per representative has grown on pace with the national average.
 Source: NCCPPR staff research from U.S. Census Bureau data
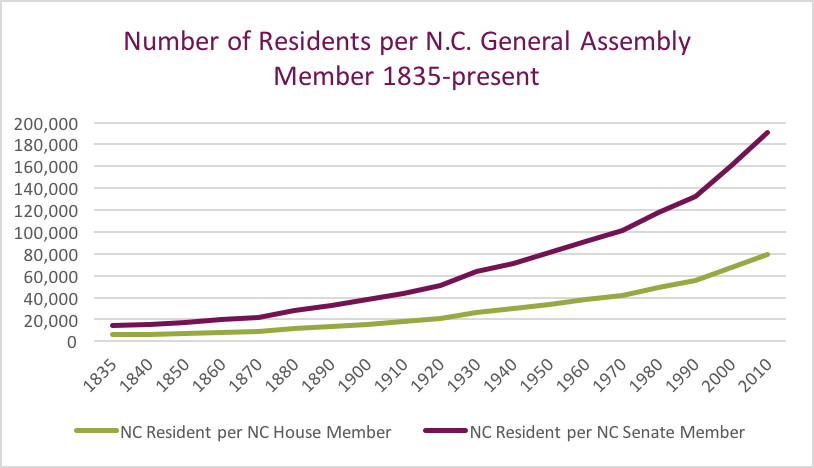
By comparison, the N.C. General Assembly has been frozen at 170 members (50 Senators and 120 representatives) since 1835. Since that time, the target number of people represented by N.C House members has risen from 6,278 in 1835, to 18,386 in 1910, to 79,462 today. In the N.C. Senate, representation numbers have grown from 15,068 in 1835, to 44,126 in 1910, to 190,710 today.
 Source: NCCPPR staff research from U.S. Census Bureau data
It is easy to get lost in the numbers, but a couple of things are noteworthy about these shifts. The number of people per U.S. House representative has grown twelvefold since the first census. The difference between states receiving the best representation and the worst representation per person is more than 400,000 people. A lot of attention in the 2021 redistricting process will center around how the lines are drawn, but an equally relevant point for discussion is that federal and state representation has been significantly diluted.
Census determines policy priorities and funding for 10 years
According to Brookings, the decennial census has a direct impact on more than $446 billion dollars in federal grants, loans, and other payments. By far the biggest census-guided assistance program is the Medical Assistance Program which grants money to the states for Medicaid and Medicare and is based on state population. In 2008, the Medical Assistance Program spent $261 billion dollars. Highway funding, Section 8 Housing Vouchers and Special Education Grants are also all distributed based on official state population and together represented more than $62 billion in 2008.
For a complete overview of how federal money is distributed by population, see the 2010 Brookings report and this overview by the Leadership Conference on Civil and Human Rights.
Less direct, but equally important, is the impact census results have on planning and public policy. Demographers use the census numbers to determine the growth projections that affect government decision-making. For example, on transportation issues the population determinations help establish transportation priorities. If a geographic region is underrepresented then that may have a significant impact on funding availability.
Statisticians believe recent census numbers have been relatively accurate, but with a population of more than 300 million people, minor errors can lead to significant funding outcomes. Many of the programs that are based on population are designed to help the underserved populations which in turn tend to be the populations most subject to undercounting. A 2010 publication by the Ford Foundation estimated that for every 100 people not counted in the 2000 Census, states lost an estimated $143,800 annually.
As the Census Bureau begins to launch its 2020 campaign, much is at stake. It is a grand tradition, one that connects us back to civilizations long ago and ultimately determines the degree to which we are represented in our government, how priorities are set, and how resources are allocated.
* Population data from this section comes from the U.S. Census Bureau via the Iowa Data Center which hosts an easy to download table.
Weekly Insight Demographics


