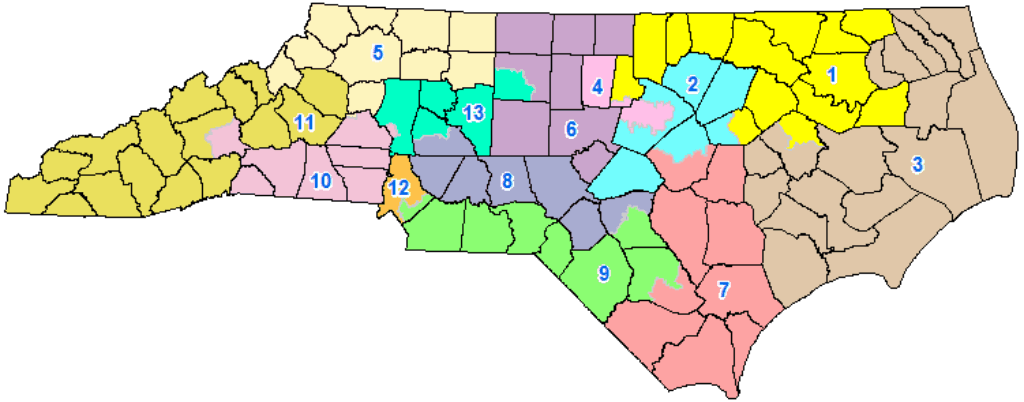
I was a minor celebrity in my University of Wisconsin “Law and Politics” class because North Carolina is a national star in redistricting litigation. Anytime we studied a North Carolina-based redistricting case – and that was more frequent than you might think – classmates would give me a knowing nod, impressed by my home state’s gumption.
The recent redistricting debates are only the most recent chapters in North Carolina’s legacy of controversial line drawing. Theoretically, the apportionment system is supposed to be simple. The U.S. Census Bureau conducts its official counting exercise at the beginning of each decade. The Bureau then takes some time process the numbers. By January 25 of the year immediately following the Census, the Clerk of the House of Representatives notifies the states of the number Congressional seats they will have for the following decade. North Carolina had 11 members of the U.S. House Representatives from 1962-1990, gained a 12th seat in the 1980 Census, and a 13th seat in the 2000 Census.
In North Carolina, the General Assembly is responsible for apportioning Congressional seats and can allocate that responsibility however it wishes.
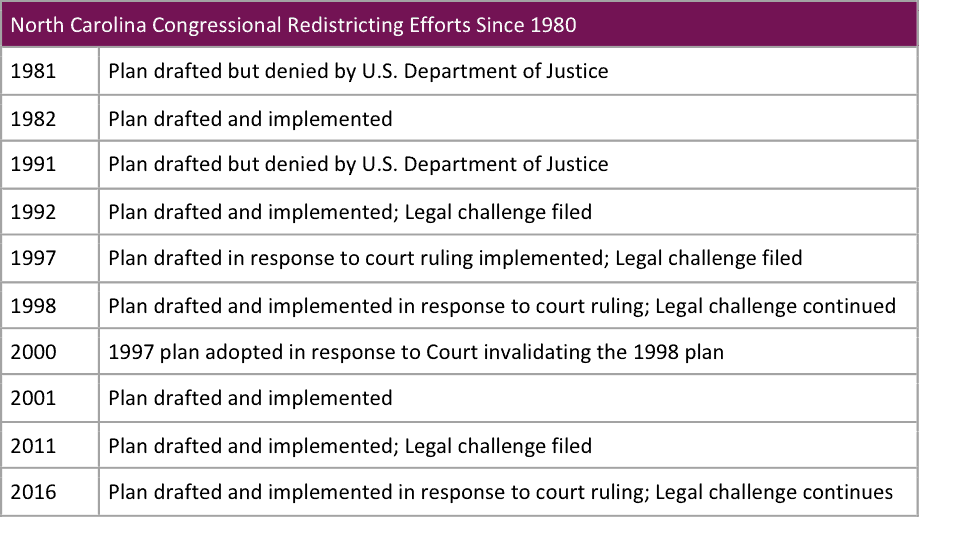
In theory, each state should have to redistrict every 10 years. States without much population loss or growth may even go multiple decades without having to make major changes to the lines. In North Carolina, that would mean that since the 1980 census, the state should have adjusted the district lines four times: 1981, 1991, 2001, 2011. In reality, there have been 10 congressional redistricting efforts during that time.
By comparison, NC General Assembly districts have been redrawn 14 times since 1981.
 There are several good resources for examining redistricting history:
- The General Assembly’s 2011 Guide to Redistricting
- NC Insight’s Analysis of the 1981 and 1991 redistricting processes
- NC Law Review Article by Robinson O. Everett regarding the 1992 redistricting cases
- A quick overview video produced by the Charlotte Observer:
In addition, there are a couple of good overviews of the current disputes and the status of various legal challenges:
- Loyola Law School’s Redistricting Cycle overview of disputes following the 2011 maps from North Carolina
- NYU Brennan Center’s January 30 overview of pending redistricting cases, including a thorough section on those in North Carolina
These disputes are full of conventional wisdom and assumptions about North Carolina’s history. Democrats complain that the Republicans have taken gerrymandering–drawing districts to favor one party or constituency–to new levels. Republicans claim that they have only done what the Democrats did for generations, which is legal as long as it is based on political party and not race or another protected class.
The Center analyzed data and assessed the history of redistricting in the state. Our goal was not to debate the legal or political philosophies behind either party’s apportionment theory. Instead, we looked at the historical data around congressional elections with an eye for how the patterns have or have not evolved over time. Here are several observations:
NC congressional races do not tend to be competitive
Between 1982 and 2016, North Carolina has held 219 biennial general elections. (This does not include special elections.) Of those, 52 (or 24 percent) were competitive.
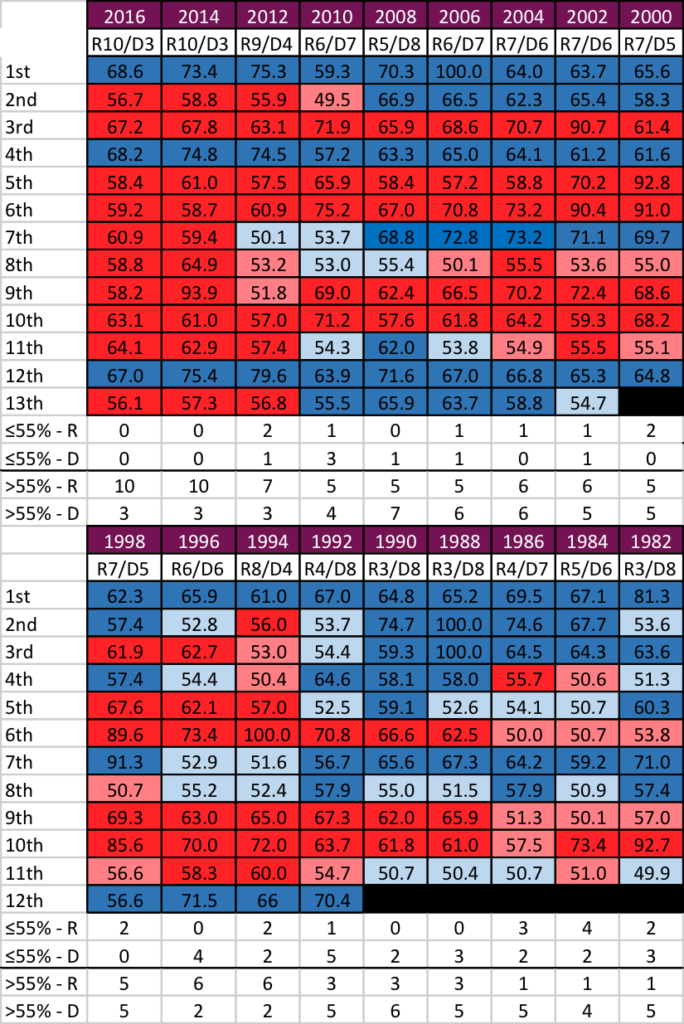
No standardized metric for defining a competitive seat exists. Political commentators have their own formulas for determining competitiveness. For the purposes of this analysis, a race was competitive if the winner won by 55 percent or less of the vote. For more extensive data on competitiveness, see the postscript below.
The number of competitive races has decreased in the last 16 years. In the 2010s, only three out of 39 races (8 percent) were competitive so far and none were competitive since 2012. In the 2000s, 10 out of 65 races were competitive (15 percent). The 1990s was the most competitive decade in recent history, with 18 out of 60 (30 percent) competitive races. As noted in the table above, the 1990s was also a decade with multiple redistricting attempts, but it is not clear how different plans affected competitiveness. In the 1980s, 10 out of 55 (18 percent) Congressional races were competitive.

Prior decades saw a more even split between parties
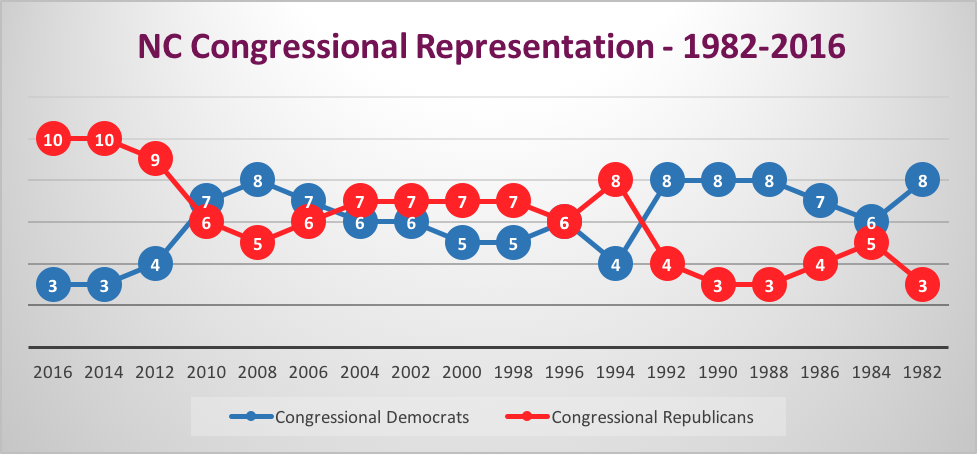
The 2016 Congressional election results confirmed the 2014 partisan split: 10 Republicans and 3 Democrats. Statistically speaking, this is an impressive gerrymandering feat. In terms of overall congressional voting statewide, the parties recently have fluctuated between 45 and 55 percent of the overall congressional votes cast.
In 2016, the first year of the current districting model, the split between votes cast for congressional candidates was 53 percent Republican and 47 percent Democratic. In 2014 and 2012, residents voted under the same district lines. The Republican vote total was 55 percent and 49 percent respectively.
 The 2000s was a much more evenly split decade on a partisan basis despite only 15 percent of the races being competitive. Control of the state’s13 congressional seats fluctuated between the political parties and never exceeded 62 percent control by one party. Similarly, the 1990s similarly saw more even partisan control over the decade. Even the 1980s, in which the Democrats maintained a clear partisan advantage throughout the decade, saw two election cycles where the parties had closer representation.

Time to relieve the pressure?
By many accounts, the political pressure for the 2020 election will be substantial. Republicans, having seemingly mastered partisan redistricting, will strive to hold onto their advantage. While Democrats, after spending 10 years in the legislative wilderness, will see the opportunity regain influence. This pressure raises the stakes for an already loaded referendum on the leadership of President Trump, US Senator Thom Tillis and Governor Roy Cooper.
The idea of removing the politics from apportionment is not a new one. According to the National Conference of State Legislatures, seven states have independent redistricting commissions and another seven have some sort of independent advisory commission. North Carolina has considered bipartisan and/or independent redistricting commissions on multiple occasions.
Most recently, the Duke University Sanford School of Public Policy led an initiative to consider and promote drawing districts outside of the legislative process. Former UNC System President and Superior Court Judge Tom Ross introduced an alternative to the 2016 voting map – one based equal population, compactness, and compliance with the Voting Rights Act.
Building on this momentum, a bipartisan group of legislators introduced legislation that would minimize the political influence on the redistricting process. The model is based on Iowa’s redistricting model which is considered to be substantially less prone to gerrymandering. Common Cause developed an easy to read synthesis of the legislation. In short, nonpartisan legislative staff would draw the maps and the General Assembly would take an up or down vote within 14 days.
Postscript: Competitiveness Data
The following charts provide the source data on competitiveness. The vertical column lists the congressional district. The shades of blue and red correspond with the political party affiliation of the winning candidate: red for Republicans and blue for Democrats. The dark red and dark blue indicate results that were not “competitive,” i.e., where the winning candidate won by more than 55 percent of the vote. The light red and light blue indicate races that were competitive. The count on the bottom indicates the number of races each cycle that were above or below the 55 percent threshold.


