A picture is worth a thousand words, and the recently launched North Carolina social determinants of health interactive map tells many stories.
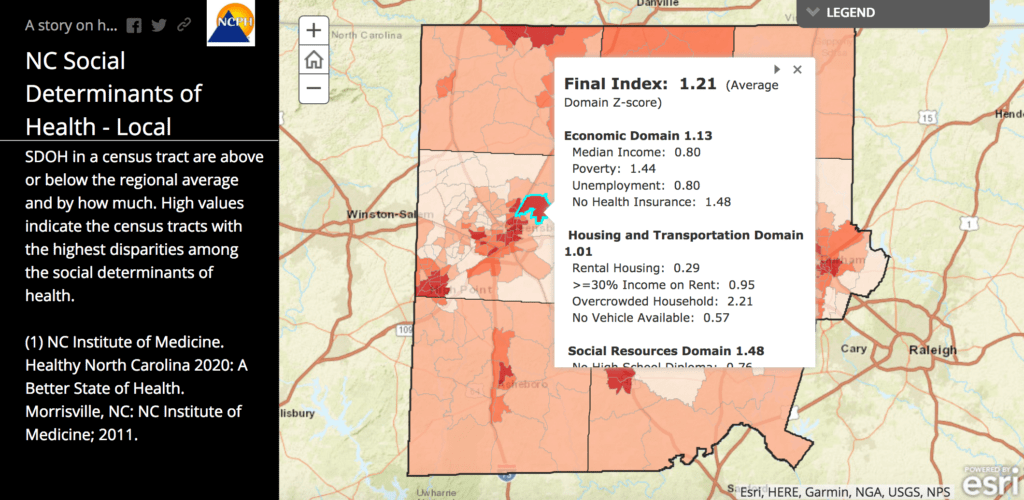
Last month the Department of Health and Human Services and the Center for Health Statistics unveiled this “deeply interactive map” detailing demographic and social determinants of health measures across the state’s 10 public health regions (organized by the 10 NC Association of Local Health Department Regions).
What are social determinants of health and why are they important?
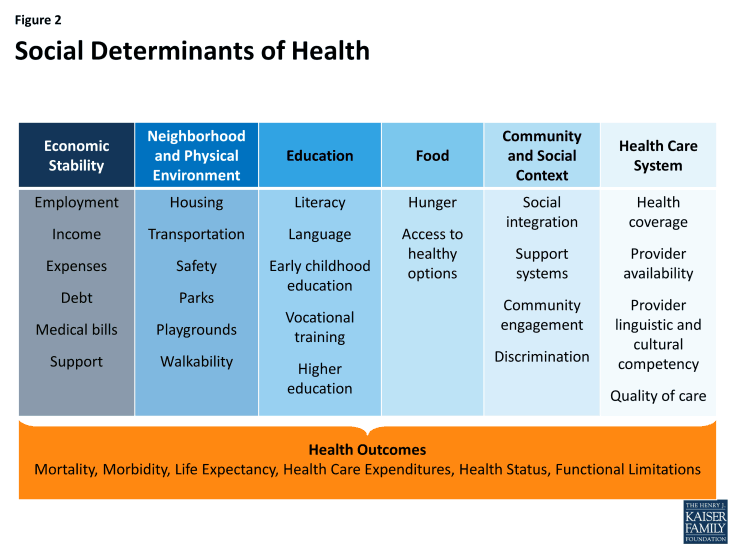
Health outcomes and wellness are not just a product of access to medical resources but are also reflective of the environments and conditions in which we live. Social determinants of health refer to the environmental and socio-economic factors known to impact health outcomes and are generally organized into five categories (detailed below by the Kaiser Family Foundations’ helpful table).
Access to and quality of health care is only one component of recognized social determinants. While traditional efforts to improve health across populations have focused on health care delivery and access, research suggests medical services may be the least determinative of mortality across populations, accounting for only about 10-15 percent of preventable deaths.

Social determinants are believed to be the driver of more than 70 percent of health outcomes. The 1.7 trillion dollar question health practitioners, payers, administrators, and stakeholders are grappling with today is how to tackle those determinants and promote healthy behaviors. Steve Shortell, dean emeritus of UC Berkley’s School of Public Health explained:
“… we can make healthy choices only if there are healthy options to choose from. We need to ensure that the decisions we make about our community are those that promote healthy living; that make it easier for us to do things that promote our health and well-being and difficult to do things that are harmful.
This means access to clean air, safe water, fresh fruits and vegetables, environmentally safe buildings, parks, recreation, roads, and education and cultural opportunities. This is the philosophy of “health in all” policies in which the goal of reducing illness and injury is embedded in cooperative efforts that link our public health and medical institutions with our education, agriculture, housing, transportation and related sectors.”
North Carolina social determinants
The NCSD interactive map is an important effort to quantify and compare social determinant indicators across regions. The map uses data from the US Census Bureau’s 2016 American Community Survey 5-year Estimates and the U.S. Department of Agriculture’s Food and Nutrition Service. In addition to a general demographic profile, the map details performance over three categories of social determinants: economic, housing and transportation, and social and neighborhood resources. This includes reporting of median household income, poverty rates, access to affordable housing (measured as a percent of households spending more than 30 percent of income on housing), lack of access to healthy foods by neighborhood, and incidence of “food deserts.”
The map is a well-organized font of information, but attempting to represent a comprehensive and holistic snapshot across regions can be overwhelming. Perhaps the most powerful component of the map is the standardization of the 12 social determinant metrics to create a composite index and compare scoring within each region in order to identify and map areas of greatest need.
Zooming in to identify and prioritize area needs
This visual representation of deficits within regions can help public health practitioners and community partners identify, target, and prioritize interventions and use of resources, as explained by State Health Director and DHHS Chief Medical Officer Dr. Betsey Tilson: “Identifying and codifying the areas of disparities in these indicators will help to inform community needs assessments and program planning.” Mapping, as it does, not only those areas of high need, but specifying the nature of structural deficits.
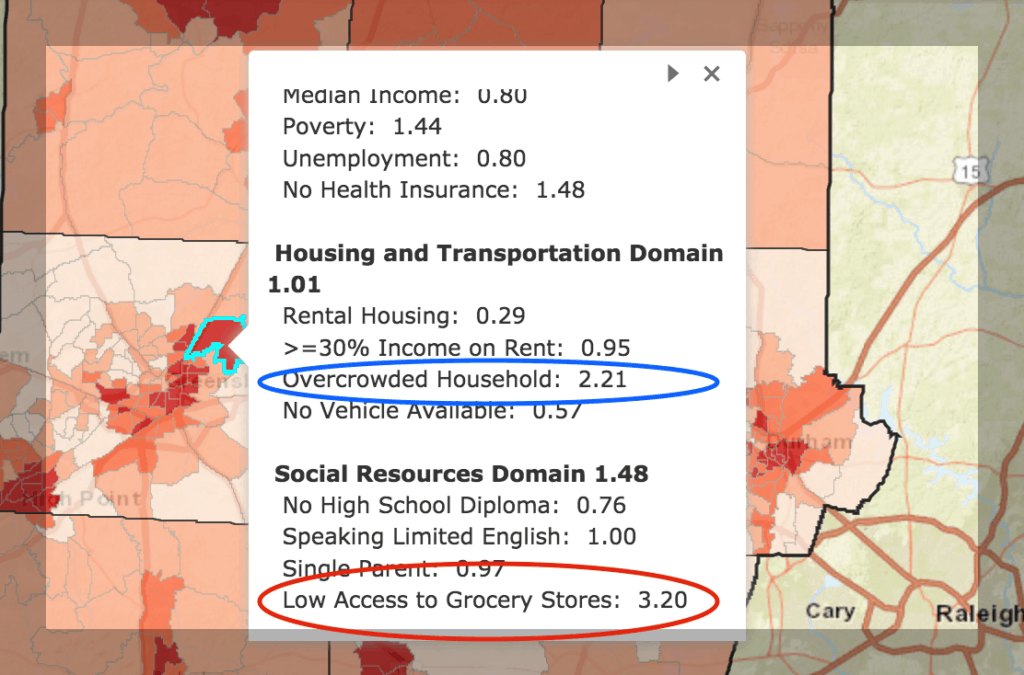
Take, for example, a review of Census Track 154.02 within McLeansville, a small town bordering Greensboro. With a composite score (z score) of 1.21, meaning it is 1.21 standard deviations from the regional mean, this region reports one of the highest disparities in social determinants across the nine-county region. In other words, about 90 percent of all tracks in the region had better performance in total social determinant metrics. (Here’s a simple recap of z scores and the standard distribution.)
Zooming in reveals the nature of need across this community: housing (relatively high incidence of overcrowded households) and access to grocery stores (3.2 standard deviations from regional mean).


The takeaway
Mapping community resources and hot-spotting geographic deficits are powerful informational and motivational tools to recognize and address the social and structural determinants impacting our communities. A picture is worth a thousand words – but what is more important here is these pictures can be expected to engender (many) thousands more words on an important topic, encouraging cross-collaboration among stakeholders to address identified deficits.
DHHS Secretary Dr. Mandy Cohen intimated as much in her public statement on the release of the interactive map, stating:
“Ultimately, we envision a North Carolina that optimizes health and well-being for all by effectively stewarding our collective resources to unite our communities and health care systems….After all, no matter what our respective goals — to mitigate the opioid crisis, to ensure our children are healthy, safe and ready to learn, to increase employment or to drive economic growth — it all begins with healthy people. To have a healthy and productive state, we need to focus on all components of what drives health.”
Weekly Insight Health & Human Services

