It is a truism in health research that the most important determinant in health care is your zip code. So much information can be derived from those five numbers, including physical access to providers and health services, comparative public infrastructure to support healthy behaviors and environments, and, of course, relative wealth. Researchers have gone so far as to assert that this string of numbers is a more important indicator of health outcomes than an individual’s genetic code (in a point to “environment” in the nature v. nurture debate).
Health, like politics, is always local.
Quantifying and illustrating the impact environment has on health outcomes is at the heart of the collaboration between the University of Wisconsin’s Population Health Institute and the Robert Wood Johnson Foundation, which released its annual report ranking the performance of (nearly) all US counties by state.
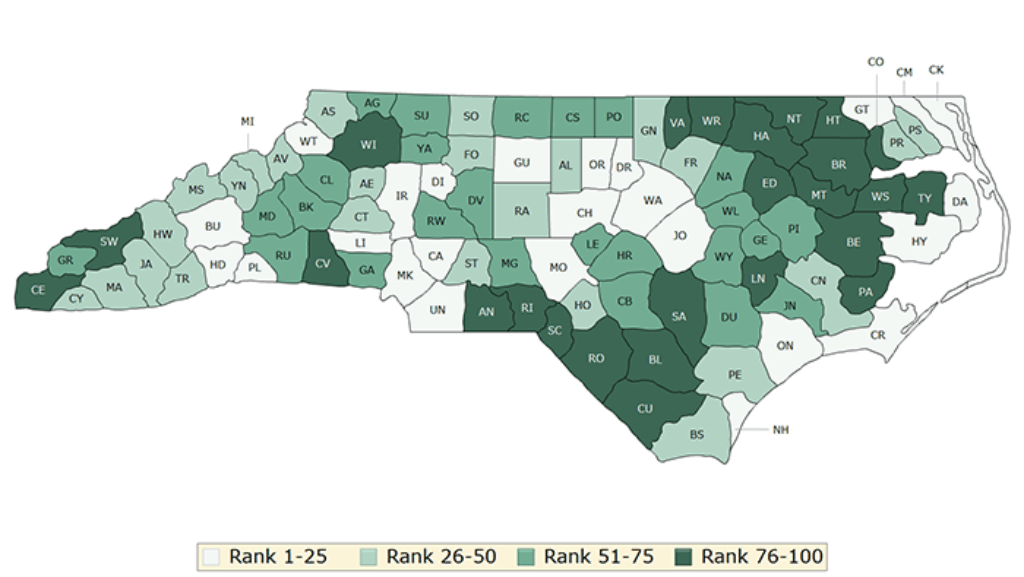
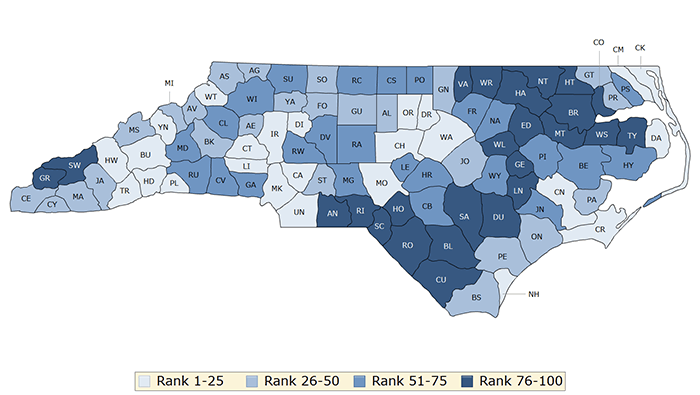
The report grades counties on two criteria: health outcomes (longevity, and self-reported health status) and health factors (those social, economic and environmental factors known to impact health outcomes). The green map above shows the ranking of health outcomes by county and the blue map below shows the ranking of health factors.

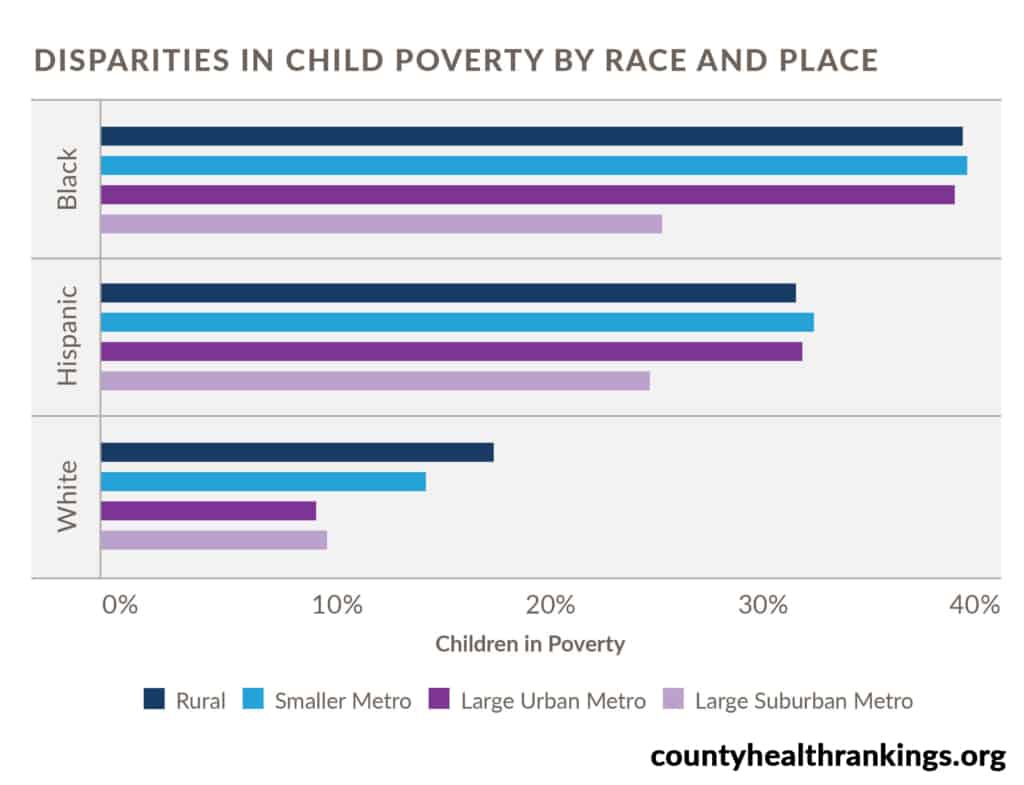
While the full national and NC State report can be read here, the primary takeaway is stark disparities in health access and quality indicators continue to persist across the state. Where we live impacts “how well and how long we live,” as summarized by Ali Havrilla, a member of the County Rankings research team. Economic and regional variation is further compounded across racial and ethnic communities.
Wealth = (improved) health
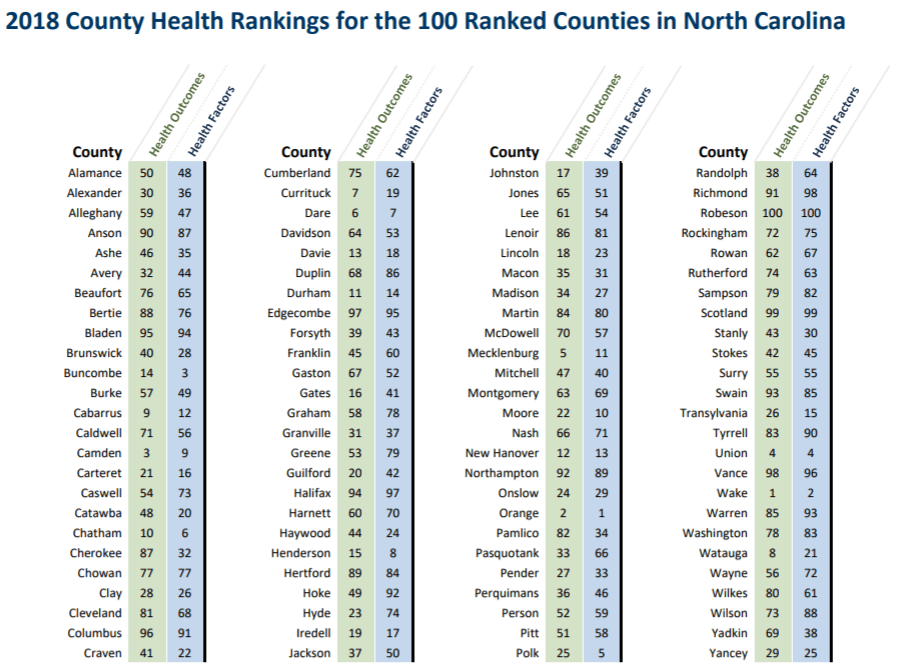
There is a “clear correlation” between a county’s median income and health outcomes. Wake, the county with the highest median income, held its number top ranking in terms of health outcomes. Scotland County, the poorest, comes in at 99. (An interactive chart compares outcomes by county income and population).

Drilling down: Birth weight as an indicator of access to care
Evidence of disparity in terms of access and quality is perhaps best illustrated by the clinical measure of incidence of low birth weight in a community. Low birth weight (defined by the World Health Organization as 5.5 pounds) is on the rise nationally and in North Carolina in particular, which ranks in the bottom quartile for infant mortality. Black women are at the highest risk for poor maternal outcomes: experiencing more than two times the incidence of fetal deaths of white and Latina/Hispanic counterparts.

Lack of access to primary care during pregnancy is one reason for poor maternal and child outcomes, as reported by NC Child’s February 2018 report. In North Carolina, one out of every five women of reproductive age is without health insurance and an estimated one-third of all North Carolina pregnancies did not receive any prenatal care in the first trimester. It is no wonder, therefore, that NC Child gave North Carolina a failing grade.
The bottom line
Rankings and grading systems always get some pushback in the context of health care delivery. Identifying accurate metrics to capture qualitative performance and perception while simultaneously ensuring an apples-to-apples comparison. But recognizing where the state falls behind or underperforms is indispensable as a “starting point for change.”
A report card does not show the entirety of an issue, but it does provide an important opportunity for correction, recalibration, and growth.
Weekly Insight Health & Human Services

