Like many 11-year olds, my morning ritual involved poring over the sports page to see how many points Michael Jordan averaged, who was leading the American League in batting average, and the latest in the Winston Cup points margin. To this day, I can still share more random facts about ACC basketball in the late 80s and early 90s than almost anything else.
Data can be magnetic. We review our pedometers to see how our health is measured. We grade our children and our schools based on performance data. Data drives our lives, but data only matters in context, and its influence rests on what we do with it.
There are a couple of things that we need to know to make data useful. First, we need a baseline. It is difficult to understand what two out of 10 hits in baseball means unless we know that three out of 10 hits in baseball is commendable.
We also need confidence that data is collected consistently so we can compare apples to apples.
On the other hand, we have to avoid the “so what do we do with that?” conundrum. Especially in the internet age when data is relatively easy to find, it is easy to collect interesting information that lacks a purpose.
I was reminded of this earlier in the week when I was telling a friend about the work the Center has been doing in its annual study of the General Assembly. He innocently asked, “Why does that matter?” It was a good question and one that I kept in mind as we assembled the first part of the Center’s legislative overview section.
With these factors in mind, the Center presents its demographic highlights of the North Carolina Senate. With each section of data, we provide basic data points. Where there is a baseline for comparison, we provide one. Where there is not a baseline, we note that absence, and it is our hope to collect this data over time. With each data section, we try to offer some insight into the relevance and application of the data.
We chose to present the data in three sections: NC Senate, NC House and the General Assembly as a whole. This week, we focus on the North Carolina Senate.
Basic Demography
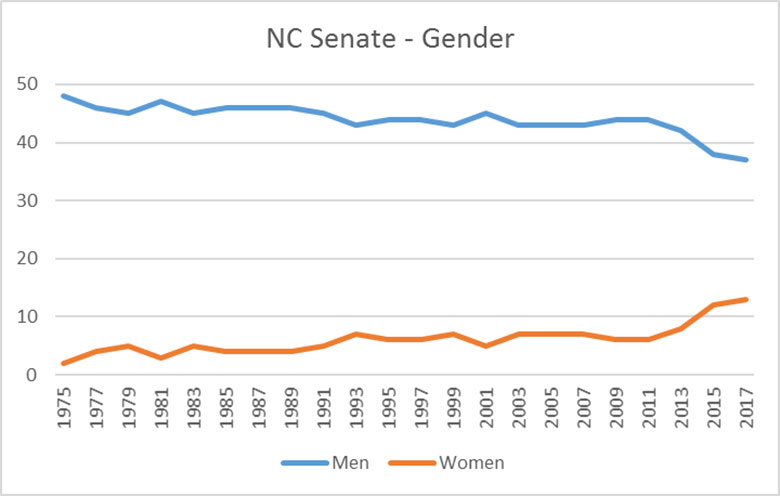
The 2017 NC Senate membership consists of 37 men (74 percent) and 13 women (26 percent). The state’s population is 51 percent female.
Historically, the Senate has seen a rise in the number of female members—a rise that has increased in the last two legislative sessions. There were eight (8) women elected to the Senate in 2013 and 12 in 2015. From 1993 to 2011, the Senate averaged six (6) women per session. Between 1975 and 1992, the Senate averaged four (4) women per session.

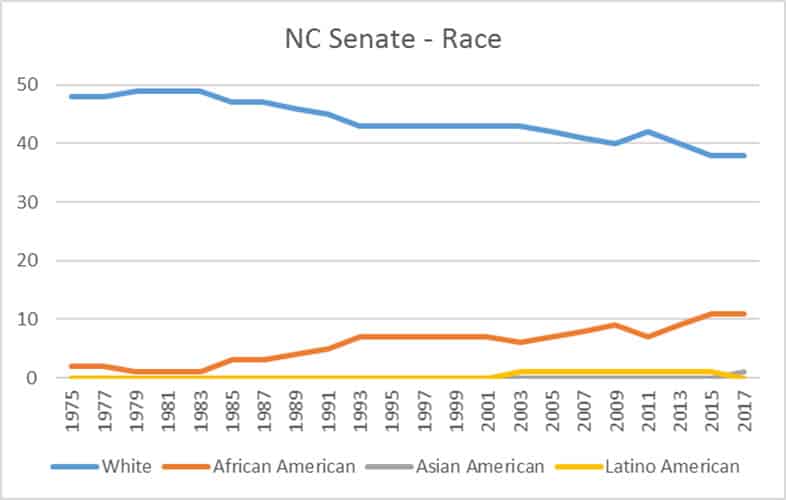
Similarly, the NC Senate has seen a rise in the number of non-White members representing the state. The 2017 Senate membership consists of 11 African-American members (22 percent), one (1) Asian-American member (2 percent) and 38 White members (76 percent). The state’s population is 22 percent African American, three (3) percent Asian American and 71 percent White.
Historically, the state’s African-American representation has risen gradually over time. From 1993 to 2001, the Senate averaged seven (7) African American members; from 1975 to 1992, the average was (2) two.
In 2015, the NC Senate saw its lone Hispanic-American member, former Senator Tom Apodaca, retire. Conversely, the Senate gained its first Asian-American member in Senator Jay Chaudhuri.

There may be some debate about the importance of gender and racial representation in serving the state’s interests. That said, if we assume that elected representatives in a democracy should generally reflect the makeup of the state, then the following points are noteworthy:
- The state’s growing Hispanic population is not represented in the NC Senate. The U.S. Census Bureau estimates that more than 900,000 (9 percent) of the state’s population is Hispanic.
- Though the number is growing, women are still significantly underrepresented in the State Senate.
- African-American membership in the NC Senate has steadily increased and is proportionate to the state’s population.
Occupation and Experience
The Center has baseline data going back to 1975 on the occupational listings of members of the General Assembly. The categories for the data have been consistent, and we continue to use these categories.
However, there have been some shifts in how we think about occupation and careers. Outside of politics, it is increasingly common for people to work in multiple occupations. Legislators are no different. Many have built relevant experiences from multiple occupations that inform their political outlooks and the ways in which they approach public policy.
For example, Senator Wesley Meredith currently owns a landscaping business in Fayetteville. Under an occupation-specific, data frame, he would count as a business person. Simply doing so, however, would miss three important data points about Senator Meredith. He holds a general contractor’s license so he is knowledgeable about construction and real estate. As a landscaper and a member of the International Society of Arboriculture, he as professional experience in agriculture. In addition, he has served in the Army and on the Fayetteville City Council. Each of those experiences is relevant to his legislative perspective but would be missed with a simple categorization.
To attempt to remedy the narrowness of occupational data, we dug beyond how legislators listed their current occupation and used publicly available sources to unpack some of the complexity in their careers.[i]
Industry Experience
| 2017 N.C. Senate Industry Experience | |
| # of Senators | Industry |
| 1 | Banking or Finance |
| 21 | Business or Consulting |
| 7 | Education |
| 5 | Farming or Agriculture |
| 5 | Health Services |
| 1 | Insurance |
| 11 | Law |
| 1 | Manufacturing |
| 1 | Ministry |
| 2 | Government or Nonprofit |
| 5 | Real Estate |
Unlike many data points, this data tells its own story and gives you a sense of the current Senate’s occupational knowledge. There are several historical points to note:
- The average number of businesspeople and lawyers in the Senate over the last 40 years hovers around 15 each. There has been an inverse relationship between the two over time. This year, there is a 40-year high in the number of businesspeople (21) and approaching a 40-year low in the number of lawyers (11).

- The number of Senators with experience in education (7) and health care (5) is currently above the 40-year average for each.
- Banking, manufacturing and insurance have all had decades with three or four senators with ties to the sector. Currently, each only has one senator with related professional experience.
- Regardless of their industrial experience, eight (8) Senators identify themselves as retired and nine (9) are small business owners or self-employed. The historical data for retirement and business ownership is difficult to sort; however, this appears to be a decrease in the average number of retirees over the last 20 years (11) and an increase in the average number of small business owners (4).
Public Service
Beginning with the 2017 session, we are tracking two new legislative experience metrics: military experience and non-military public service experience. Many of these public experiences fall outside members’ professional experiences and are not easily aggregated from other sources. Knowing the complexity of many public issues, relevant public experience is as important as professional experience.
We defined public service to include the following experiences: experience as a government employment, local elected office (city, county or school board), or state elected office. This metric of public service does not include volunteer or other community work.
- Number of Senators with military experience: 10
- Number of Senators with experience in public service outside of the Senate: 26
Education
The final element of demographic data is educational experience. In my recent interview with Duke professor Nick Carnes, he shared political science research connected to educational background. Whether or not a member attended a public college or university makes a difference, especially when it comes to funding priorities for public higher education.
Additionally, like industrial and public service experience, educational background information gives citizens insight into how members’ view a variety of public policy issues.
The Center has not historically tracked educational background for the General Assembly as a whole. We will begin doing so now and hope this new information will assist readers in understanding their representation.
- Number of Senators educated by North Carolina community colleges: 5
- Number of Senators with a college degree: 44
- Number of Senators who attended college in North Carolina: 26
- Number of Senators who attended a public university in North Carolina: 20
- Appalachian State University: 3
- East Carolina University: 1
- NC A&T State University: 3
- North Carolina Central University: 1
- North Carolina State University: 3
- University of North Carolina at Chapel Hill: 8
- Western Carolina University: 1
- Number of Senators with a graduate degree: 29
Stay tuned for the next element in the Center’s profile of the North Carolina Legislature.
[i] For the sake of consistency, we will maintain the Center’s 40-year old occupational categories, but we will use our discretion to list multiple occupational categories under each legislator. As a result, when the astute policy wonk adds together the occupational numbers for the legislators in 2017, more than 50 occupations are represented.
Weekly Insight State Government


