
I recently returned from a trip to India with a group of North Carolina teachers and leaders to study STEM best practices. One of my biggest takeaways was the emphasis on innovation that we saw in schools, educational foundations, and companies. From the 172-acre hands-on science center at Agastya International Foundation to the focus on developing local inventors at SELCO Foundation, children and communities were exposed to innovation and encouraged to create their own solutions to local problems.
I left India thinking about how we can foster innovation in the United States, and in particular in North Carolina. Innovation is central to economic growth, so understanding what spurs innovation is crucial for the future of our state.
Recent research by Bell et. al. and Akcigit et. al. shed light on this question. Bell et. al. and Akcigit et. al. use census and other administrative data from 1996 to 2014 and 1940 to 1960, respectively, to learn more about the “lifecycle” of inventors — a term they define as anyone who has filed a patent. They use data on parental income, race, and geographic location growing up to reveal trends in children who go on to become inventors. There are several interesting and important findings.
Children of higher income parents have a much greater chance of becoming inventors than children of lower income parents.
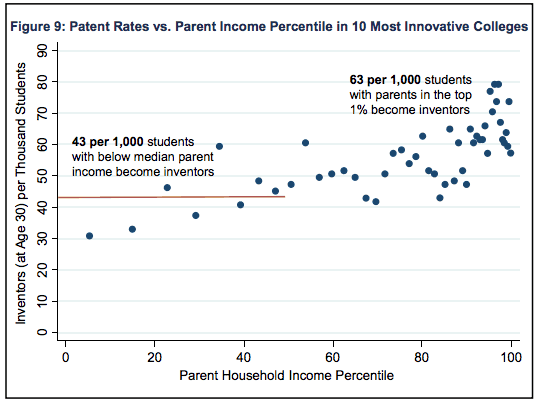
Both Akcigit et. al. and Bell et. al. find that parental income is highly associated with the likelihood of a child becoming an inventor. Bell et. al. find that children with parents in the top one percent of the income distribution were 10 times more likely to be an inventor, measured by having a patent, than children with parents in the bottom half of the income distribution. This trend has remained relatively constant from 1940 until now; the graph on the top uses data from 1940 to 1960 whereas the graph on the bottom uses data from 1996 to 2014, yet the patterns look remarkably similar.
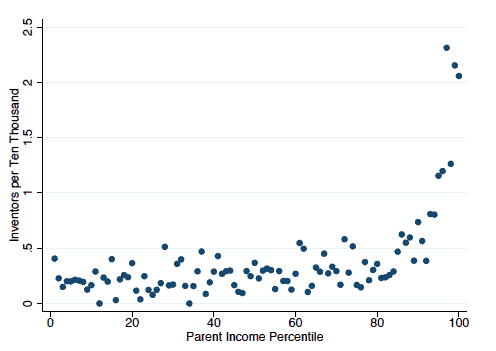
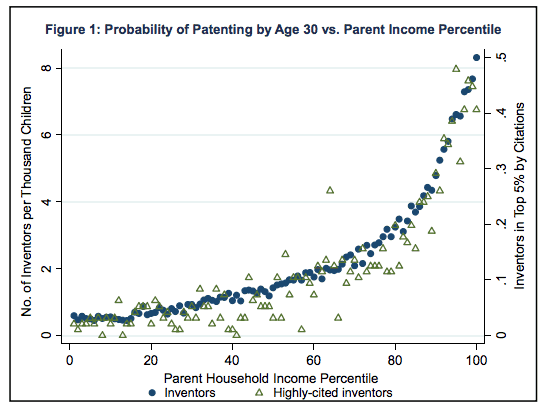
There are two potential explanations for this phenomenon. The first is that children from higher-income parents inherit higher ability and thus are more likely to become inventors. The second is that children from higher-income parents have greater access to educational opportunities that promote innovation. Which explanation is true matters — if the gap in invention rates between rich and poor kids is due to genetics, there is little that policymakers can do. However, if the gap is due to barriers to educational opportunities and other resources, policymakers can address those factors.
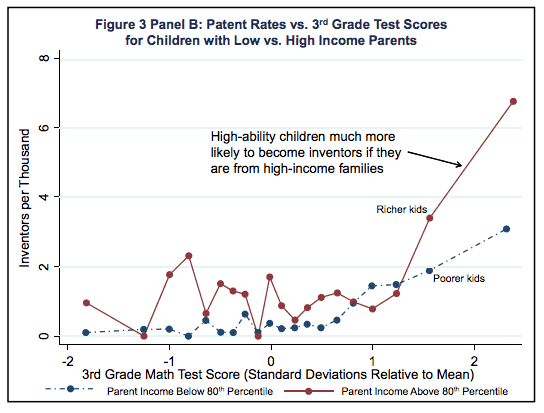
Bell et. al. look at standardized test scores to explore this issue. Using New York City schools data, they show that third grade math test scores only explain about 30 percent of the gap between rich and poor children’s invention rates. In the graph below, we can see that higher income children have a greater likelihood of becoming inventors than lower income children with the same third grade math test scores.
Significant racial and gender gaps exist in likelihood of becoming an inventor
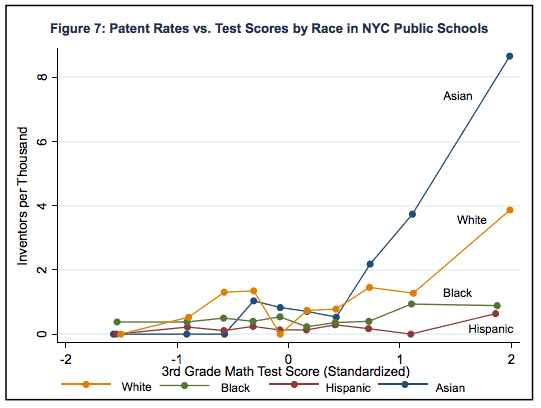
Bell et. al. find racial gaps in the likelihood of becoming an inventor that are greater in higher ability children. For example, of students with the highest third grade math test scores, about 4 of every 1,000 white students became inventors compared to about 1 of every 1,000 black students. In contrast, over 8 of every 1,000 Asian students became inventors. Differences in inventor rates between racial groups are less pronounced in children with lower math scores. It is not surprising that the gaps are bigger for students scoring higher in math since math ability is highly correlated to the likelihood of inventing.
Bell et. al. also examine the gender gap in likelihood of becoming an inventor. Figure 4 shows the percentage of female patent holders by the year in which they were born. Of the inventors born in 1980, only about 15 percent are female. As the graph shows, this rate is growing at 0.25 percent per year, meaning it will take 140 years at this rate to achieve an inventor cohort where 50 percent are female.
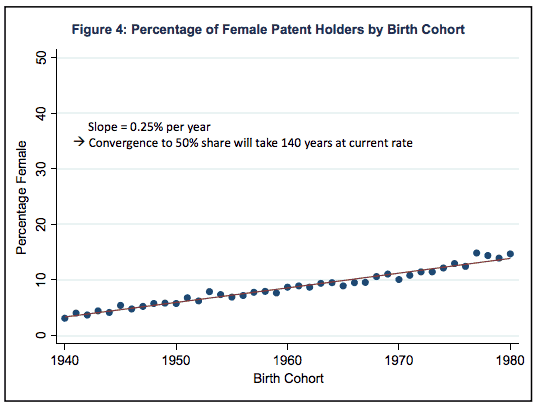
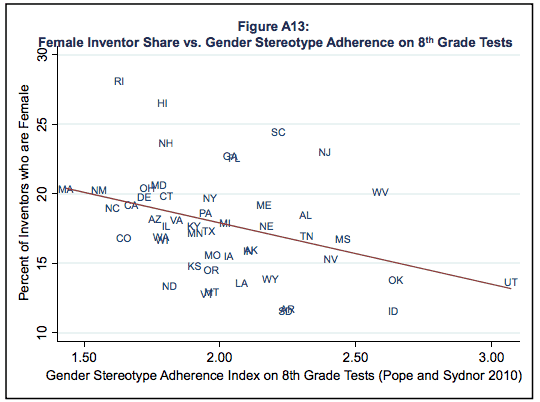
What can explain this huge gender gap? Bell et. al. use third grade math test scores and find that math scores explain only three percent of the gap between male and female inventor rates, so clearly ability is not the issue. They then look at inventor rates broken down by states and use Pope and Sydnor‘s measure of how 8th grade state tests adhere to gender stereotypes. They find a correlation between higher gender stereotypes and lower shares of female inventors. In the graph below, Massachusetts’ standardized tests are the least gender stereotyped whereas Utah’s are the most. As you can see, the percent of female inventors is significantly higher in Massachusetts than Utah. While this does not necessarily explain the gender gap in inventors, it does provides clues.
School matters: children who do well in school and go to good colleges are more likely to become inventors
As children get older, the test score gap widens between low-income and high-income students. Bell et. al. find that by 8th grade, test scores explain 53 percent of the inventor gap between low-income and high-income children.
The college that students attend also has an effect on their likelihood of becoming inventors. Bell et. al. find that at the top 10 most innovative colleges, as measured by the colleges whose graduates have the most patents, 5.6 percent of students have a patent by the age of 30 — a rate that is about 28 times the average for the whole population. And while parental income plays a large role in determining who can attend these colleges, once students are at one of the top 10 innovative colleges, parental income has a much smaller effect on likelihood of becoming an inventor, as the graph below shows.
Innovation spurs innovation: children exposed to innovation are more likely to become inventors
Bell et. al. look at how a child’s exposure to innovation during childhood impacts their likelihood to become inventors. They characterize exposure to innovation in 3 ways:
- Whether a child’s parent was an inventor
- The innovation in the industry of a child’s father
- The innovation in the area where the child grew up
They find that children whose parents were inventors are much more likely to become an inventor themselves. Specifically, they have a patent rate of 11.1 per 1,000 as compared to a patent rate of 1.2 per 1,000 for children whose parents are not inventors. Interestingly, they find that parent and child patents are closely related, meaning that children who have parent inventors go on to invent something closely related to their parent’s invention, showing the knowledge transfer that happens during their childhood.
For children whose parents are not inventors, Bell et. al. find that they are more likely to become an inventor if their father worked in an industry with many inventors. They hypothesize that exposure to a network and industry with many inventors causes children to become inventors at greater rates than the general population who lack this exposure.
Finally, they also look at how one’s neighborhood growing up affects the likelihood of becoming an inventor. Using the commuting zones where inventors grew up, Bell et. al. show that children who grew up in “innovation hotspots,” or commuting zones that have higher rates of inventions, were more likely to become inventors. Clearly, there are many factors of innovation hubs that may explain this effect, but Bell et. al. control for a wide variety of factors, including whether the child’s parents are inventors, and still find a positive relationship between living in an innovation hotspot and becoming an inventor.
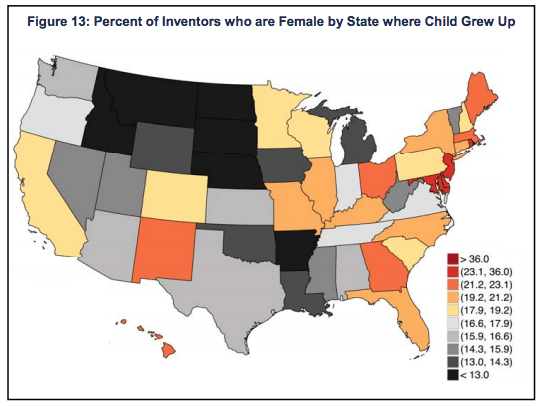
As the graph below shows, the top innovation hotspots are in the Northeast, upper Midwest, Silicon Valley, and areas of Utah and Colorado. Children who grew up in the South, with the exception of a few areas in Texas, Florida, and North Carolina, were much less likely to become inventors.
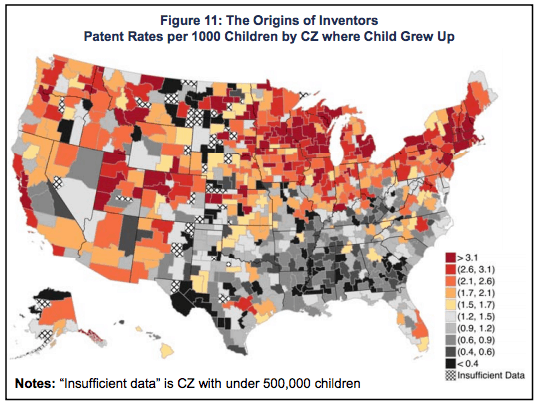
When you look at where female inventors grew up, the South is doing a little better:
Lessons for North Carolina
Looking forward, our state needs innovation to spur growth and growth to spur more innovation. So what can we learn from these studies to help policymakers and local communities create the conditions for innovation?
- Low-income students face significant barriers to becoming inventors, including the lack of a quality education. Ensuring that low-income students are meeting grade level standards by 8th grade is critical in fostering innovation.
- Minorities and women are highly underrepresented in the innovation world. Increasing the share of minority and female inventors should be a top priority to foster more innovation in our state.
- Exposure to innovation matters. Creating opportunities for students to experience innovation will have long-run effects on the trajectory of our students.
For the future of North Carolina, we must be intentional about creating the conditions for all children to have the opportunity to innovate.
Weekly Insight

