“The only valid philosophy for North Carolina is the philosophy of total education; a belief in the incomparable worth of all human beings … whose talents the state needs and must develop to the fullest possible degree,” said W. Dallas Herring, the chair of the State Board of Education, in 1964, several months after the establishment of the N.C. Community College System.
“That is why,” Herring added, “the doors to the institutions in North Carolina’s system of community colleges must never be closed to anyone of suitable age who can learn what they teach.”1
To this day, Herring’s “open door” philosophy animates the work of North Carolina’s 58 community colleges. State law requires these institutions to admit all “students who are high school graduates or who are beyond the compulsory age limit of the public school system and who have left the public schools.”2 And adult students across North Carolina actively turn to community colleges to meet their educational needs. In 2016-17, some 697,000 people in all, or nine of every 100 adult North Carolinians, studied at a community college.3
Funding for North Carolina’s community colleges comes from state appropriations, local government funds, tuition receipts, and federal and other sources. State appropriations are the single largest source of funds, accounting for $57 of every $100 in fiscal year 2015-16.4 Of that state funding, nearly 90 percent is awarded to local colleges based on a funding formula.5
The state funding formula is largely based on full-time equivalent enrollment; in short, funding is based on an institutional input. While North Carolina has used a formula-based model to fund its community colleges for decades, as have many states, the formula has long suffered from shortcomings that have hindered community colleges from realizing their missions. In 2008, I wrote about these issues for the Center’s May 2008 issue of North Carolina Insight.
In recent years, the N.C. General Assembly has revised the funding formula in ways that have fixed certain flaws and have yielded a model deemed “functional and generally acceptable” by key stakeholders.6 Despite these improvements, colleges still face financial challenges. Chief among these are the stability and adequacy of state funding, the promotion of student success, the shifting of costs to students via tuition increases, and the overarching issue of equity.

The N.C. Community College System (NCCCS) traces its roots to 1963, when a set of existing junior colleges and industrial education centers were combined and placed under state authority so as to create “one system of post-high school institutions offering college parallel, technical-vocational terminal and adult education tailored to area needs.”7 Today, the state’s 58 community colleges offer programs in three broad areas.8
Curriculum programs offer credit-bearing courses that lead to the awarding of certificate, diplomas, and the associate of arts or associate of science degree; programs range from one semester to two years in length and prepare students for entry-level positions in industry or for transfer to a four-year university at the level of a junior.
Continuing education courses are non-credit bearing courses that are occupational, academic, or recreational in nature.
Basic skills instruction assists adults who are deficient in basic literacy skills or who did not complete high school with improving their skills and earning a high school equivalency credential; instruction also is available for adults seeking to learn English as a Second Language.
The defining trait of the NCCCS is its “open door” policy, under which it serves all eligible individuals who wish to study. The emphasis on universal access is further reflected in the fact that most every North Carolinian lives within 30 miles of a campus, combined with a longstanding commitment to keep tuition charges as low as possible.9 In 2016-2017, an in-state student in a curriculum program paid $76 per credit hour, which translated to $2,432 annual tuition charge (exclusive of fees and living costs) for a full-time student.10
The combination of the “open door” policy, a large geographic footprint, and low tuition has made the NCCCS a major provider of postsecondary education. In 2016-17, some 697,114 individuals, or nine of every 100 North Carolina adults, took at least one community college course.11 In general the overwhelming majority of students enroll in continuing education courses, followed by curriculum programs and basic skills instruction.12
Because many community colleges began as local educational institutions linked to local public school systems, today’s system relies on a hybrid governance structure. Local boards of trustees oversee individual colleges, while the State Board of Community Colleges and the System Office in Raleigh provide general oversight, management, planning, and coordination.13

The legislation that established the NCCCS envisioned three broad sources of financial support. The state would pay 65 percent of total costs, primarily instructional ones, while county governments would pay for 15 percent of total costs, primarily facility ones; the remaining 20 percent would come from tuition receipts.14 While the percentages have fluctuated over the years and while some other sources—federal funds in particular—are now available, the basic pattern remains in effect today, with the state playing the role of the primary funder.
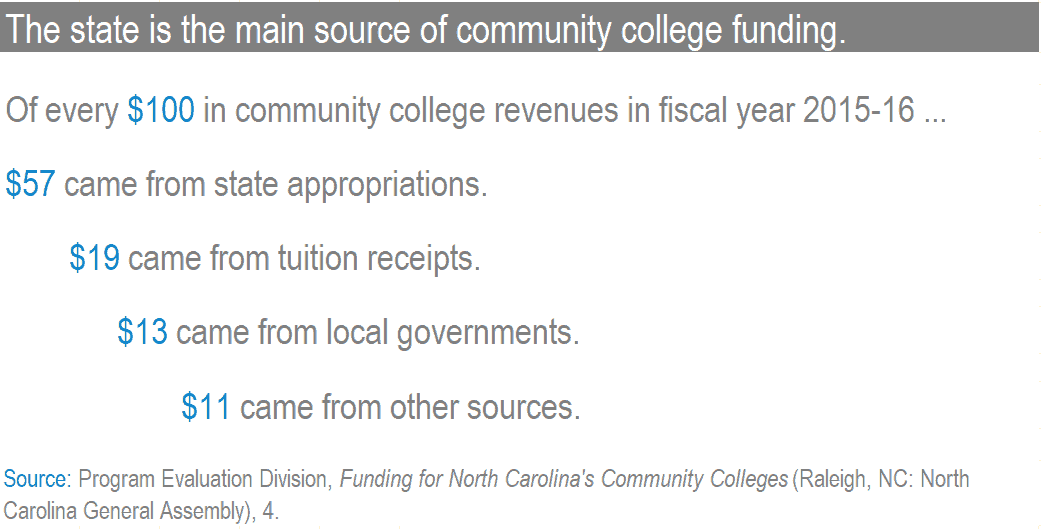
In fiscal year 2015-16, the NCCCS received $1.9 billion in revenues. Of every $100 in revenue, $57 came from state appropriations, $19 from tuition receipts, $13 from local governments, and $11 from other sources.15
The $1.1 billion appropriated to the NCCCS from the state’s General Fund accounted for 9 percent of all appropriations on education; for perspective, consider how the public schools received $8.5 billion in appropriations (69 percent), the University of North Carolina System, $2.7 billion (22 percent).16 On a relative basis, the NCCCS received the least amount of support, and the University of North Carolina system, the most support.17

The “open door” nature of community colleges and their role in serving adult learners creates special financial challenges. When economic conditions deteriorate, community college enrollment usually rises as displaced workers seek out retraining. Yet declining tax revenues make it hard to meet the increased service demand. The typical result is a drop in funding.
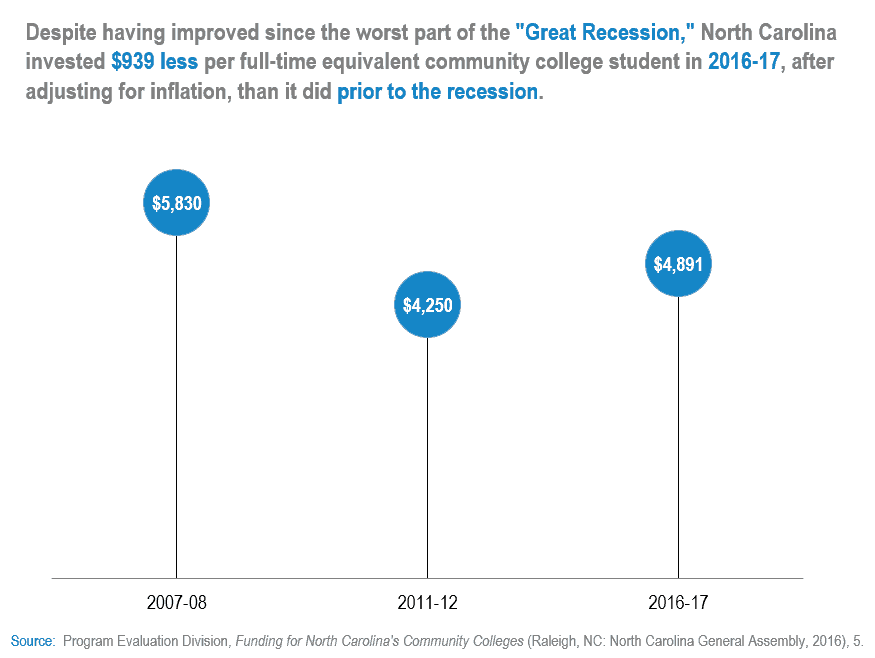
According to one analysis, inflation-adjusted state support for the NCCCS fell by $939 per full-time equivalent student between 2007-08 and 2016-17; this 16 percent decline over a nine-year period reduced funding to $4,891 per full-time equivalent student from $5,830.18
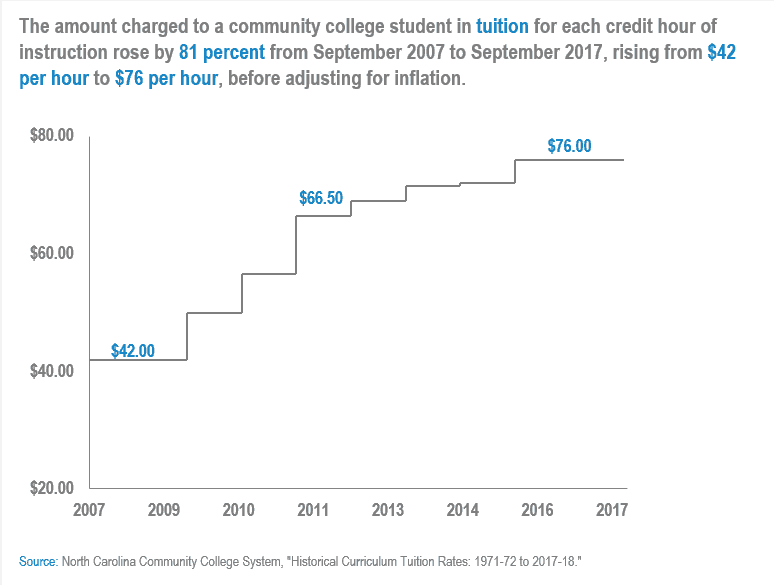
At the same time, the legislature has steadily raised tuition charges. In 2007-08, in-state students enrolled in curriculum programs paid $42 per credit hour (which equals $51 after adjusting for inflation), but by 2018, the charge per credit had risen to $76; that translates to an inflation-adjusted increase of 49 percent.19
Although tuition charges in North Carolina remain low compared to those in other states, the increases are noticeable and present hardships to displaced, dislocated, or low-income adults wishing to study at a community college.

The General Assembly distributes funding to community colleges primarily on the basis of student enrollment. In fiscal year 2016-17, some 83 percent of state funding was distributed based on enrollment, with the remaining funds coming from base allotments (15 percent) and performance awards (2 percent).20 What are full-time equivalent enrollment and allotments?
The core unit used to calculate local funding in North Carolina is full-time equivalent (FTE) enrollment. For curriculum programs, a college earns one FTE for every 512 hours of class or laboratory hours scheduled in a year.21 Continuing education courses, meanwhile, generate one FTE for every 688 hours of scheduled class time.
In a given year, colleges receive budget FTE based on the higher of the FTE earned in a given year or the average of the actual FTE earned over the prior two years.22 This is done to stabilize funding against sudden budget fluctuations caused by enrollment changes stemming from factors beyond a college’s control, such as shifts in the business cycle or population changes.
Each budget FTE carries a specific allotment, or dollar value, that ranged in 2016-17 from $4,270 to $2,792.23 In general, the highest allotments are provided to curriculum courses in high-cost, high-demand fields such as health care and technical education, the lowest to short-term occupational courses that do not lead to a third-party or recognized industry credential. For a more detailed look at enrollment and FTE, read our EdExplainer.
https://www.ednc.org/2019/03/05/edexplainer-community-college-enrollment/
The evolution of the funding model, 1967-2010
North Carolina has awarded state funding to community colleges based on a formula linked to FTE enrollment since 1967.24 The original formula was a projection-based model that took a college’s enrollment from the prior fall term and added 60 percent to that total. Projection-based models remained in use until the late 1980s, when the discovery of fraudulent financial practices at Cape Fear Technical Institute (now Cape Fear Community College) led to the identification at other colleges of questionable practices designed to “pad” enrollments so as to draw more state funding. Then, in 1988, errors in the calculation of the projection model resulted in a multi-million dollar excess appropriation that the NCCCS was allowed to retain.
In response to these problems, the General Assembly shifted to a funding-in-arrears model, under which colleges receive funding based on their actual FTE enrollment in past years.25 A shortcoming of this model is that it potentially exposes colleges to sharp annual budget fluctuations. To promote stability, the General Assembly has employed different formula criteria to differing degrees of effectiveness. From 1994 to 1998, the state used a “growth and decline” rule that increased a college’s funding only if its enrollment changed by a certain percentage from a prior year. When that system proved problematic, the state moved in 1999 to a rolling average rule. Under that model, a school’s budget FTE is computed based on the higher of its actual FTE for the most recent school year or its actual FTE enrollment in a defined past period. From 1998 to 2013, state funding was based on the higher of actual FTE for the last school year or average actual FTE enrollment over the prior three years.
Recent changes to the funding model, 2011-present
North Carolina has allocated state funds to community colleges based on a funding-in-arrears model for some 30 years, although the model has undergone occasional revisions. Since 2010, the General Assembly has implemented three noteworthy changes to the funding system.
First, in 2011, the General Assembly implemented tiered funding, under which the value of an FTE varies by program type.26 All course offerings today are separated into one of four categories, with the value of an FTE earned in each category being set equal to a percentage of the value of an FTE earned in the preceding one. The idea is to provide greater funding to programs that are more expensive to operate, such as health care and technical programs, or that support industry and lead to the awarding of in-demand industry credentials.
Second, in 2013, the General Assembly changed the rolling-average rule to a two-year period from a three-year period.27 This move was controversial because it reduced system-wide state funding by $21 million dollars, or 1.8 percent. The reason for the decline was tied to enrollment decreases associated with an improving economy. Under a two-year average rule, funding drops more sharply when enrollment declines than under a three-year average rule.
Finally, the General Assembly opted in 2013 to expand and revise the use of performance-based funding.28 North Carolina first implemented performance-based funding in 1999, and under the old framework, individual colleges that achieved certain goals could retain a fractional percentage of their prior year’s state appropriation. Now, there is a fixed amount of money available to all 58 colleges based on their performance on eight measures relative to all the other colleges. Performance-based funding nevertheless remains a small part of total state funding, amounting to no more than $2 of every $100 in state appropriations.
Arguments about the appropriateness of the state’s funding model have occurred as long as the model has been in use. The blue-ribbon Commission on the Future of the North Carolina Community College System wrote in its 1989 final report:
“The system’s funding formula, which allocates resources to the colleges in proportion to the number of full-time equivalent students they enroll in each of their programs, fails to respond adequately to the current needs of the system. The formula does not account for differential costs among programs, gives little flexibility for new program initiatives, and does not reflect the costs of serving part-time students. Rather than encouraging colleges to achieve planned results, the formula looks backwards to measure past behavior. As a result, accountability, planning, and creativity suffer. Moreover, imbalances in the values assigned to different categories of courses severely limit the system’s ability to respond to emerging needs.”29
An extensive literature of reports and studies has documented the shortcomings of North Carolina’s model of community college funding. The N.C. Center for Public Policy Research’s 2008 report detailed four significant flaws with the funding-in-arrears model.30 Those flaws were an inability to accommodate rapid enrollment change, a lack of differentiated funding based on real program costs, limited resources to start or expand programs, and an absence of dedicated capital funds.
Funding stability: A perennial challenge for “open door” institutions
Historically, the greatest criticism of the funding-in-arrears model is its lack of funding stability. As “open door” institutions, community colleges cannot cap enrollments to manage costs; rather, they must accommodate all qualified students. State funding, however, is based on past enrollment, meaning that if actual enrollment rises too much, a college may find itself serving students for whom no state funds are available. Moreover, enrollment tends to increase greatly during recessions, which is also when additional state resources are scarce. The resulting budgetary pressures often hinder colleges from planning for the future, retaining quality instructors, and ensuring programmatic continuity.31
The General Assembly has tried in the past to insulate community colleges from funding instability by altering the design of the funding formula, although it has never found a version that satisfies all stakeholders. The “growth and decline” rule used in the 1990s was seen as overly punitive for colleges experiencing rapid growth, while the “rolling average rule” causes problems during times of rapid enrollment change.32 And the 2013 switch to a two-year average from a three-year average arguably made the funding model more volatile. Just as community college enrollments rise during recessions, they tend to drop as economic conditions improve. Under a two-year average, the drop in funding associated with enrollment declines occurs more sharply than with a three-year average.33
One mechanism for dealing with funding instability associated with rapid enrollment increases is an enrollment growth reserve that a college could tap if its enrollment grows above its budget level by a specified percentage. At one point in time, occasional non-recurring appropriations from the General Assembly provided some reserve funding, but the amounts appropriated seldom were sufficient.34 Since 2011, the State Board of Community Colleges has been allowed to keep over-realized tuition and fee receipts for the purposes of reserve funding, but a lack of such receipts has resulted in no real recent contributions.35
At the other end of the spectrum, the General Assembly’s Program Evaluation Division has mooted the idea of a stop-loss provision as a tool to prevent a college experiencing enrollment declines from losing more than a specified percentage of its state funding in a given year. Such a policy might ameliorate some of the problems tied to the switch to the two-year average rule.36 That said, an investment of additional state resources likely would be necessary to create any type of sustainable enrollment growth reserve, stop-loss mechanism, or combination of the two.
Funding adequacy: An essential need for the state’s lead workforce agency
The distinctive history of the NCCCS has led the system to be just as much of an actor in the state’s workforce and economic development systems as it is in the higher education system. The multiple demands placed on the system raise regular questions about whether the system has adequate funding to achieve its multifaceted educational and economic goals.
Seen in one light, the community college system receives modest funding compared to the rest of the educational system in both absolute and relative terms.37 The NCCCS received $1.1 billion in state funding during the 2015-16 fiscal year, versus $2.7 billion for the University of North Carolina, and $8.5 billion for the public schools. Put differently, of every $100 in state support for education, $69 went to the public school system, $22 to the public university system, and $9 to the NCCCS. Within the higher education space, funding per community college FTE equaled $4,608, as compared to $13,101 per FTE earned by the University of North Carolina.
One area where the issue of funding adequacy is most visible is faculty compensation. According to data compiled by the Southern Regional Education Board, the NCCCS employed a total of 23,354 instructors in 2013-14, the last year with full national data; of those instructors, 71 percent worked on a part-time basis, a share somewhat higher than the regional one.38 Among full-time instructors, the average salary in 2015-16, again the last year with complete data, was $47,362 per year, an amount well below the national figure of $60,423 and the regional one of $52,632 per year.39
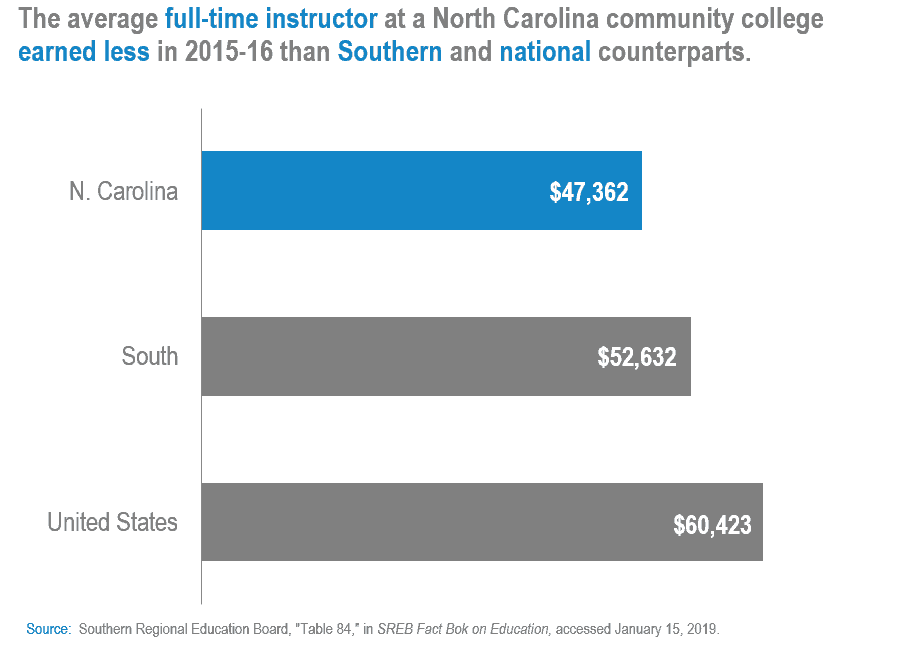
A reliance on a comparatively low-paid and contingent faculty corps makes it difficult for North Carolina’s colleges to staff instructional programs adequately and consistently. These difficulties are especially pronounced in such high-demand fields as nursing and technology, in which the salaries offered to potential instructors pale in comparison to what industry offers.40 Yet without qualified instructors, community colleges are unable to offer the programs that will allow North Carolinians to access growing, well-paying fields. Unfortunately, the current funding system does not generate the resources needed to address faculty compensation issues.
This touches on a related problem: the historic inability of the funding model to support high-cost instruction in fields that prepare students for technical industries. Prior to the 2013 adoption of tiered funding, the value of an FTE was the same for every program in a category irrespective of actual programmatic costs. Many colleges consequently were forced to limit enrollments in more expensive fields, divert resources from other programs, or eliminate certain high-cost programs to fund others.41 Although the new tiered funding mechanism varies the value of an FTE based on costs and workforce needs, it remains unclear if the values associated with different FTE categories actually capture true differences in costs and are sustainable.42
Finally, the current funding model does little to meet capital needs. When the NCCCS was established in 1963, the legal responsibility for the capital costs associated with land purchases, building construction, and non-instructional equipment was assigned to local governments.43 State funds, however, can support such items provided they are matched on a $1 to $1 basis.44 Yet, there is no permanent, recurring source of state funds to support capital needs, even on a matched basis.
At times, some projects on specific campuses have received individual appropriations through the General Fund, while the system as a whole occasionally has benefited from voter-approved bond issuances, such as the 2000 Higher Education Bond and the 2016 Connect NC Bond.45 Although the devolved governance structure makes it hard to generate detailed capital estimates, a 2016 presentation by the NCCCS System Office to a legislative commission estimated total local capital needs as being in excess of $2 billion.46

Debates about the appropriateness of North Carolina’s funding model for community colleges traditionally have centered on institutional impacts, with the assumption being that institutional benefits ultimately will accrue to students. The relationship between funding choices and student success, however, has received greater attention in recent years. Viewed in that light, the state’s funding model suffers from weaknesses that impede student success.
Performance funding: An appealing, unproven framework
The increased attention to student success manifests most clearly in the incorporation of performance funding into the state’s funding framework. The concept of linking public investments in higher education to educational outcomes instead of inputs, as is the case with most funding formulas tied to FTE enrollment, originated nationally in the 1970s, came into favor in the early 1990s, fell out of favor circa 2000, and re-emerged over the past decade.47
As noted earlier, North Carolina implemented a small performance-based funding component in 1999 and overhauled that component in 2013. The current framework allows individual colleges to compete for a share of a dedicated funding pool based on their relative performance on eight measures that include such things as the share of first-year students who meet a specified level of academic progress and the share of credential-seeking students who complete a curriculum within a given period of time.48
Despite the popularity and intuitive appeal of performance funding, there exists little firm evidence supporting its effectiveness, and what little evidence exists is dated.49 It also is an open question whether performance funding creates disincentives to serving non-traditional or at-risk students—such as low-skilled working adults or low-income students—on the grounds that it is harder to help such students meet the standards needed to draw performance awards.50
Performance-based funding still accounts for a small portion (some 2 percent) of the total state support provided by North Carolina for its community colleges, but if the system is to expand, careful attention must be paid to choosing the proper measures, selecting realistic benchmarks, judging an institution’s performance in light of its mission, providing funding amounts that are worth the effort involved in achieving the specified performance goals, and encouraging schools to serve all students, including those facing the greatest barriers to success.51
Supporting a changing student body
Community colleges in North Carolina occupy a place in the educational system that is “betwixt and between.” On the one hand, the historical roots of many colleges in local public school systems imbues them with certain traits of K-12 education—most notably, the requirement to serve every eligible student but also the mandate to provide remedial education to adults who lack a basic education or high school diploma. On the other hand, the colleges confer recognized academic degrees, many of which qualify their holders to transfer into four-year institutions. The provision of technical programs, meanwhile, often gives community colleges an (undeserved) perception of being trade schools instead of proper colleges.
When combined with their relative affordability, this mix of missions results in community colleges acting as the main provider of postsecondary education to a wide swath of adults. Data from the Southern Regional Education Board show that community colleges enrolled 47 percent of all degree-seeking undergraduate students in North Carolina, along with 42 percent of all first-time undergraduate students.52 Among degree-seeking students, community colleges educate 44 percent of the state’s female students, 45 percent of its African-American students, and 53 percent of its Hispanic students.53 Despite serving a diverse population, community colleges receive, as noted earlier, fewer resources on both an absolute and relative basis than other parts of the state’s educational system.
Add to this dynamic the fact that community colleges enroll a disproportionate share of low socioeconomic status students. The legislature’s Performance Evaluation Division noted in a 2016 report that low socioeconomic status students outnumber high socioeconomic status by a ratio of 2:1 at community colleges, while high socioeconomic students outnumber low socioeconomic students by a ratio of 14:1 at four-year institutions.54 Unfortunately, the current funding model makes no allowance for schools that serve a disproportionately high number of low socioeconomic students—a reality that prompts periodic calls for exploring ways of incorporating need-based funding into the statewide funding framework.
Finally, community colleges serve a large proportion of part-time students. Some 70 percent of all part-time students in North Carolina study at a community college, according to one recent estimate, yet the funding model does not consider enrollment status.55 The use of budget FTE totals to determine funding allotments instead generates fewer resources for colleges that enroll more part-time students.56 Irrespective of their enrollment status, students require supportive services—such as academic counseling, job placement, and tutoring—if they are to persist in and complete a program of study in a reasonable timeframe. This explains why studies dating back to the 1980s have called for the state to use unduplicated headcount figures rather than budget FTE (or a blend of the two) for the purposes of funding student support services.57
Recognizing the “Great Cost Shift”
North Carolina, like most every state, is required to pass a balanced budget. During recessions, states with balanced budget requirements often find themselves squeezed between reduced revenues and the need to fund non-discretionary services such as public education. One area that states can cut is higher education, partly because they can defray the cuts by raising tuition.
Following the onset of the “Great Recession” in late 2007, North Carolina reduced budget support for its two-year and four-year institutions of higher education. A 2018 study by the Center on Budget and Policy Priorities, a think tank in the District of Columbia, found that, after adjusting for inflation, total per student spending on higher education in North Carolina fell by 20 percent between 2008 and 2018; that translates into a decline of $2,357 per student.58 These cuts occurred alongside increases in tuition charges at both four-year and two-year schools.
Data more specific to the NCCCS supports the general pattern described by the Center on Budget and Policy Priorities. After adjusting for inflation, total state support for the NCCCS fell by $939 per FTE between 2007-08 and 2016-17. This 16 percent decline over a nine-year period lowered funding to $4,891 per FTE from $5,830.59
At the same time, inflation-adjusted tuition charges at the NCCCS have risen by 49 percent since 2007-08. That year, in-state students enrolled in curriculum programs paid $42 per credit hour (or $51 after adjusting for inflation), but by 2018, the charge per credit had risen to $76.60 Put differently, total annual tuition for a full-time, in-state student, after adjusting for inflation, increased to $1,216 from $816 in no more than 10 years. Note these figures exclude institutional fees and living costs, both of which add markedly to the total cost of attendance.
While tuition charges in North Carolina remain low compared to those in other states, the pattern seen since 2007-08 is consistent with a long-term, nationwide disinvestment in public higher education that Demos, a public policy organization in New York City, has dubbed “The Great Cost Shift.”61
The consequences of this shift have been borne by low-income students, many of whom either forego higher education or borrow heavily to attend. The result is a narrowing of educational opportunities, especially for those who could benefit the most, such as many of the students served by North Carolina’s 58 community colleges.
North Carolina funds its community colleges primarily through the awarding of state funds to local colleges based on a funding-in-arrears model. Although this model has undergone some needed improvements in recent years, it remains troubled by certain perennial questions pertaining to its ability to provide stable, adequate, and equitable funding. Concerns about how best to promote student success—concerns driven in part by the changing nature of the student body—recently have joined those historic concerns.
Exacerbating these issues has been a reduction in state funding and a shifting of costs to individual students via higher tuition charges. Absent additional changes, the North Carolina Community College System (NCCCS) will likely struggle to achieve its multifaceted educational and economic mission, in the process narrowing, if not ultimately closing, the open doors that long have contributed to improvements in collective and individual well-being.
- John Lee Wiggs, The Community College System in North Carolina: A Silver Anniversary History, 1963-1988 (Raleigh, NC: North Carolina State University, 1989), 12. ↩
- N.C. Gen Stat. § 115D-1. ↩
- N.C. Community College System, “Annual Curriculum Student Enrollment by College: 2016-2017”; and N.C. Community College System, “Annual Continuing Education Student Enrollment by College: 2016-2017”; and U.S. Census Bureau, Population Estimates Program, 2016. ↩
- Program Evaluation Division, Funding for North Carolina’s Community Colleges: A Description of the Current Formula and Potential Methods to Improve Efficiency and Effectiveness (Raleigh, NC: North Carolina General Assembly, 2016), 4, http://www.ncleg.net/PED/Reports/documents/CCFunding/CC-Report.pdf. ↩
- Program Evaluation Division, Funding for North Carolina’s Community Colleges, 2. ↩
- Program Evaluation Division, Funding for North Carolina’s Community Colleges, 1. ↩
- The Report of the Governor’s Commission on Education Beyond the High School (Carlyle Commission) (Raleigh, NC: 1962), xi-xiii. ↩
- Program Evaluation Division, Funding for North Carolina’s Community Colleges, 3. ↩
- John Quinterno, “Community Colleges in North Carolina: What History Can Tell Us about Our Future,” North Carolina Insight, May 2008, 66. ↩
- N.C. Community College System, “Historical Curriculum Tuition Rates,” accessed October 13, 2018, https://www.nccommunitycolleges.edu/sites/default/files/basic-pages/finance-operations/historical_curriculum_tuition_rate_summary.pdf. ↩
- N.C. Community College System, “Annual Curriculum Student Enrollment by College: 2016-2017”; and N.C. Community College System, “Annual Continuing Education Student Enrollment by College: 2016-2017”; and U.S. Census Bureau, Population Estimates Program, 2016. ↩
- N.C. Community College System, “Annual Curriculum Student Enrollment by College: 2016-2017”; and N.C. Community College System, “Annual Continuing Education Student Enrollment by College: 2016-2017.” ↩
- Quinterno, “Community Colleges in North Carolina: What History Can Tell Us about Our Future,” 65. ↩
- Quinterno, “Community Colleges in North Carolina: What History Can Tell Us about Our Future,” 65. ↩
- Program Evaluation Division, Funding for North Carolina’s Community Colleges, 4. ↩
- Program Evaluation Division, Funding for North Carolina’s Community Colleges, 3-4. ↩
- Program Evaluation Division, Funding for North Carolina’s Community Colleges, 3- 4. ↩
- Program Evaluation Division, Funding for North Carolina’s Community Colleges, 5. ↩
- N.C. Community College System, “Historical Curriculum Tuition Rates;” and U.S. Bureau of Labor Statistics, Consumer Price Index. ↩
- Program Evaluation Division, Funding for North Carolina’s Community Colleges, 9. ↩
- The 512 hours per year figure is based on 16 hours of scheduled class or laboratory time per week for 16 weeks, which equals 256 hours in a semester, multiplied by two semesters per year. ↩
- Program Evaluation Division, Funding for North Carolina’s Community Colleges, 7. ↩
- Program Evaluation Division, Funding for North Carolina’s Community Colleges, 20. ↩
- Unless otherwise noted, all information in this paragraph is based on Program Evaluation Division, Funding for North Carolina’s Community Colleges, 10-12. ↩
- Unless otherwise noted, all information in this paragraph is based on Program Evaluation Division, Funding for North Carolina’s Community Colleges, 10-12. ↩
- Unless otherwise noted, all information in this paragraph is based on Program Evaluation Division, Funding for North Carolina’s Community Colleges, 18-22. ↩
- Unless otherwise noted, all information in this paragraph is based on Program Evaluation Division, Funding for North Carolina’s Community Colleges, 10-15. ↩
- Unless otherwise noted, all information in this paragraph is based on Program Evaluation Division, Funding for North Carolina’s Community Colleges, 23-28. ↩
- Commission on the Future of the North Carolina Community College System, Gaining the Competitive Edge: The Challenge to North Carolina’s Community Colleges (Raleigh, NC: 1989), 13. ↩
- John Quinterno, “Key Issues Facing the N.C. Community College System: Enrollment Trends, Faculty Compensation, Funding Formulas, and Strategic Planning,” North Carolina Insight, May 2008, 207-221. ↩
- Quinterno, “Key Issues Facing the N.C. Community College System,” 216. ↩
- Program Evaluation Division, Funding for North Carolina’s Community Colleges, 11-12. ↩
- Program Evaluation Division, Funding for North Carolina’s Community Colleges, 15-16. ↩
- Quinterno, “Key Issues Facing the N.C. Community College System,” 216. ↩
- Program Evaluation Division, Funding for North Carolina’s Community Colleges, 33. ↩
- Program Evaluation Division, Funding for North Carolina’s Community Colleges, 33. ↩
- Unless otherwise noted, all information in this paragraph is based on Program Evaluation Division, Funding for North Carolina’s Community Colleges, 3-4. ↩
- Southern Regional Education Board, “Table 76: Part-Time Faculty and Graduate Assistants as a Percent of Total Instructional Faculty at Public Colleges and Universities,” in SREB Fact Book on Education, accessed January 15, 2019, https://www.sreb.org/post/part-time-faculty-and-graduate-assistants-percent-total-instructional-faculty-public-colleges. ↩
- Southern Regional Education Board, “Table 84 : Average Salaries of Full-Time Instructional Faculty at Public Two-year Colleges and Technical Institutes or Colleges,” in SREB Fact Book on Education, accessed January 15, 2019, https://www.sreb.org/post/average-salaries-full-time-instructional-faculty-public-two-year-colleges-and-technical. ↩
- Quinterno, “Key Issues Facing the N.C. Community College System,” 215. ↩
- Quinterno, “Key Issues Facing the N.C. Community College System,” 216. ↩
- Program Evaluation Division, Funding for North Carolina’s Community Colleges, 18 and 34. ↩
- Jennifer Haygood, NC Community College System Capital Needs.” Presentation to Blue Ribbon Commission to Study the Building and Infrastructure Needs of the State, Raleigh, NC, March 28, 2016, https://www.ncleg.gov/documentsites/committees/bcci-6641/Community%20Colleges%20and%20the%20University%20of%20North%20Carolina/NCCCS_System_BlueRibbon.pdf. ↩
- N.C. Gen Stat. § 115D-31. ↩
- Haygood, “NC Community College System Capital Needs.” ↩
- Haygood, “NC Community College System Capital Needs.” ↩
- John Quinterno, Making Performance Funding Work for All (Chevy Chase, MD: Working Poor Families Project, 2012), 3-6, http://www.workingpoorfamilies.org/wp-content/uploads/2015/05/policy-brief-spring2012.pdf. ↩
- Program Evaluation Division, Funding for North Carolina’s Community Colleges, 25-28. ↩
- Quinterno, Making Performance Funding Work for All, 2. ↩
- Quinterno, Making Performance Funding Work for All, 10. ↩
- For a detailed discussion, see Quinterno, Making Performance Funding Work for All, 7-12. ↩
- Southern Regional Education Board, “Table 36: Enrollment in Two-Year Colleges,” in SREB Fact Book on Education, accessed January 15, 2019, https://www.sreb.org/post/enrollment-two-year-colleges. ↩
- Southern Regional Education Board, “Table 30: Enrollment of Women,” in SREB Fact Book on Education, accessed January 15, 2019, https://www.sreb.org/post/enrollment-women; Southern Regional Education Board, “Table 32: Enrollment of Black Students,” in SREB Fact Book on Education, accessed January 15, 2019, https://www.sreb.org/post/enrollment-black-students; Southern Regional Education Board, “Table 33: Enrollment of Hispanic Students,” in SREB Fact Book on Education, accessed January 15, 2019, https://www.sreb.org/post/enrollment-hispanic-students. ↩
- Program Evaluation Division, Funding for North Carolina’s Community Colleges, 36. ↩
- Southern Regional Education Board, “Table 27: Part-Time Enrollment,” in SREB Fact Book on Education, accessed January 15, 2019, https://www.sreb.org/post/part-time-enrollment. ↩
- Program Evaluation Division, Funding for North Carolina’s Community Colleges, 32. ↩
- Program Evaluation Division, Funding for North Carolina’s Community Colleges, 32. ↩
- Michael Mitchell, Michael Leachman, Kathleen Masterson, and Samantha Waxman, Unkept Promises: State Cuts to Higher Education Threaten Access and Equity (Washington, DC: Center on Budget and Policy Priorities, 2018), 4-5, https://www.cbpp.org/sites/default/files/atoms/files/10-4-18sfp.pdf. ↩
- Program Evaluation Division, Funding for North Carolina’s Community Colleges, 5. ↩
- N.C. Community College System, “Historical Curriculum Tuition Rates;” and U.S. Bureau of Labor Statistics, Consumer Price Index. ↩
- John Quinterno, The Great Cost Shift: How Higher Education Cuts Undermine the Future Middle Class (New York: Demos, 2012), https://www.demos.org/sites/default/files/publications/TheGreatCostShift_Demos_0.pdf. ↩

