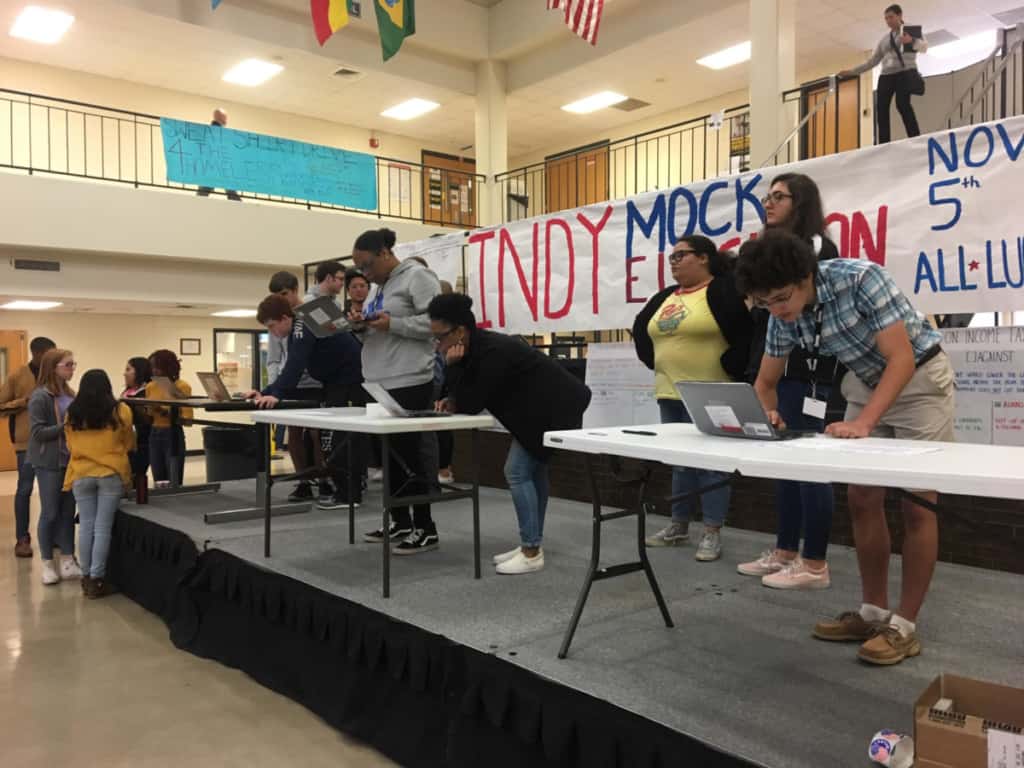
As the country voted on Tuesday, high school students from North Carolina had the chance to participate in simulation elections at their schools using EducationNC’s national award winning First Vote NC program. In total, over 13,700 students in 65 schools across the state participated. See a map of participating schools below.
First Vote NC allows high school students to participate in online, simulated elections so they graduate civic ready. With a free curriculum for teachers, customizable ballots based on the school’s address, and an “I Voted” sticker for students after they finish, First Vote aims to provide an authentic voting experience for students so they get in the habit of voting before graduating high school.
While there were no statewide partisan races in North Carolina this year, students had the chance to vote on US representatives, state senators, and state representatives along with a host of other races. They also voted on the six constitutional amendments. View results by school here.
Constitutional amendments
North Carolina had six proposed constitutional amendments on the ballot this year. On Tuesday, voters approved four of them — protection of the right to hunt and fish, increasing rights for crime victims, capping the income tax at seven percent, and requiring voters to show photo identification — and rejected two amendments that would have given the legislature significant control over judicial appointments and reshaped the elections board.
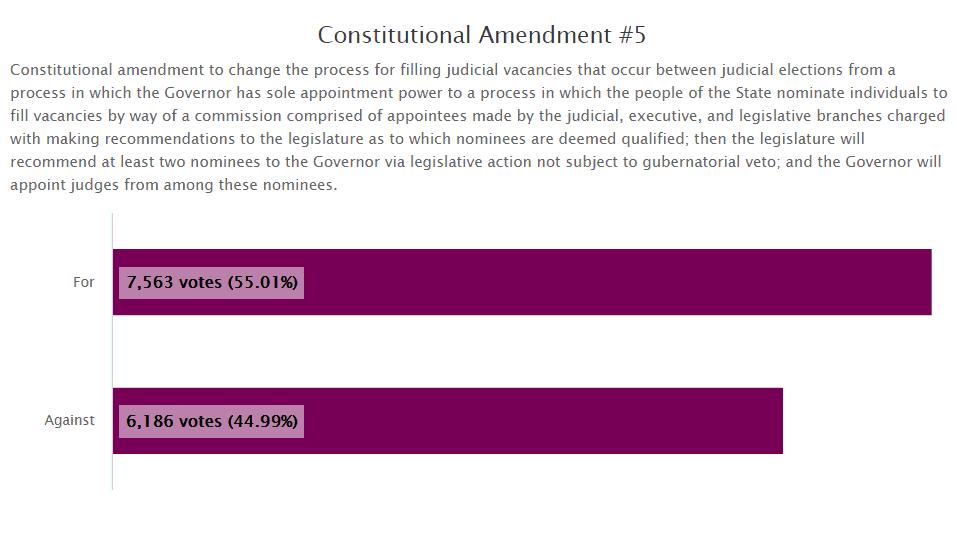
Through the First Vote platform, high school students had the opportunity to vote on the six proposed constitutional amendments as well. First Vote students approved all six constitutional amendments, some by wide margins. The closest vote was on amendment five, the amendment to grant the legislature significant control over judicial appointments, with 55 percent voting for and 45 percent voting against. View the other constitutional amendments First Vote results here.
U.S. House of Representatives
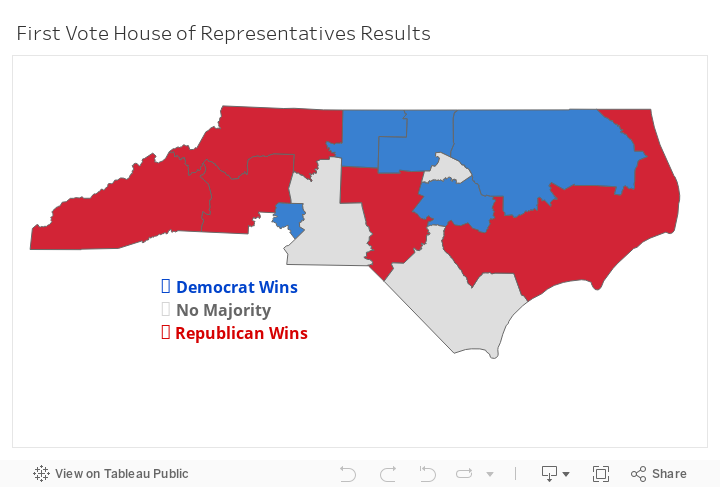
High schools in each of the 13 U.S. House of Representatives districts voted on these races. All but one district, District 3, had competitive races. In District 3, the Republican incumbent Walter Jones ran unopposed.
First Vote allows students to select “No selection,” which is the equivalent of not voting for anyone in that particular race. The map below shows how First Vote students voted in each of the 13 U.S. House districts. The blue-shaded districts indicate where the majority of First Vote students voted for the Democrat, and red-shaded districts are where the majority of First Vote students voted for the Republican. In the three grey-shaded districts, no candidate won a majority (over 50 percent) of the votes.
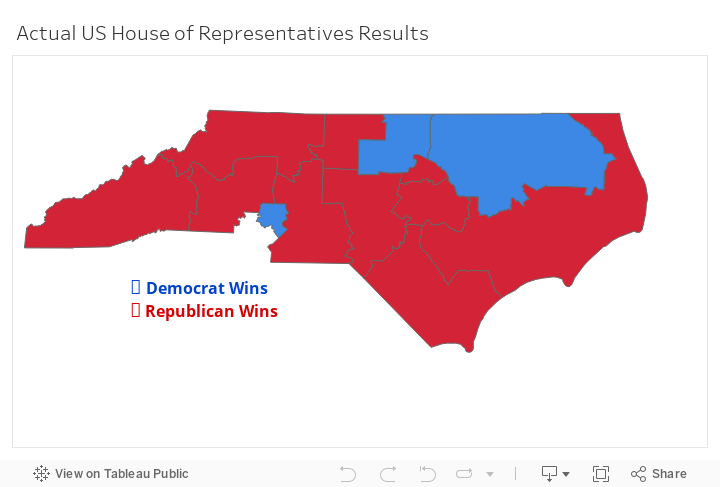
Hover over the districts to see the breakdown in how students voted, and scroll to the map below to see the actual results from North Carolina voters. View the results for each school here.
Exit poll data and issue-based questions
In addition to the regular ballot, First Vote also asks students to complete an exit poll. The exit poll contains questions about demographics, whether the adults in their household vote, whether the students plan on voting when old enough, how often they attend a religious service, how they get their political news, and more. View full results of the exit poll here.
One exit poll question asked, “If you were to register today, what would be your party affiliation?” Almost 40 percent of students stated they either didn’t know or would register as unaffiliated, with 32 percent selecting Democrat, 26 percent selecting Republican, and 3 percent selecting Libertarian.
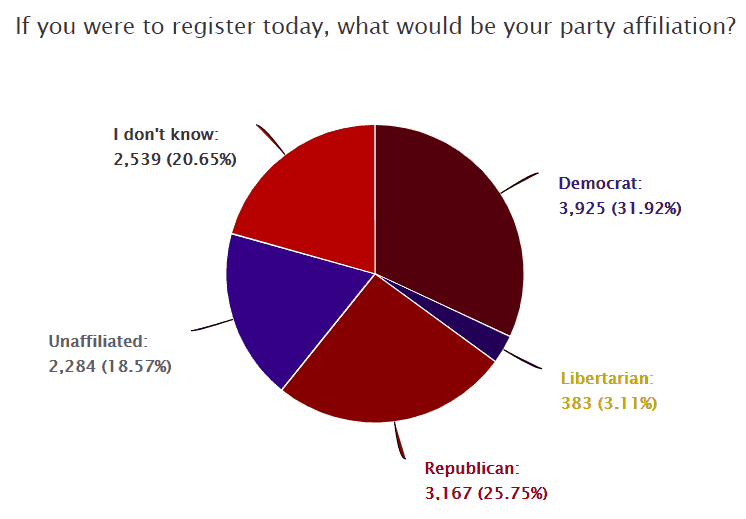
By comparison, 38 percent of North Carolina registered voters as of November 6, 2018 are registered as Democratic, 30 percent as Republican, 32 percent as unaffiliated, and 0.5 percent Libertarian.
Perhaps unsurprisingly, the First Vote population was more racially diverse than current North Carolina registered voters. Of the high school students who participated, 51 percent were white, 21 percent black, 10 percent Hispanic, 8 percent Asian/Pacific Islander, 7 percent other, and 2 percent American Indian.
Comparatively, North Carolina registered voters are 68.5 percent white, 22 percent black, 8.7 percent other, 2.7 percent Hispanic, and 0.8 percent American Indian.
In terms of where the students live geographically, 44 percent of students said they live in a suburban area, 29 percent in a rural area, and 27 percent in an urban area.
The exit poll also asked the students about their primary source of political news. Just over a third (35 percent) of students said their primary source of political news is social media, 29 percent said television, 26 percent said friends and family, and about 10 percent said newspapers and magazines.
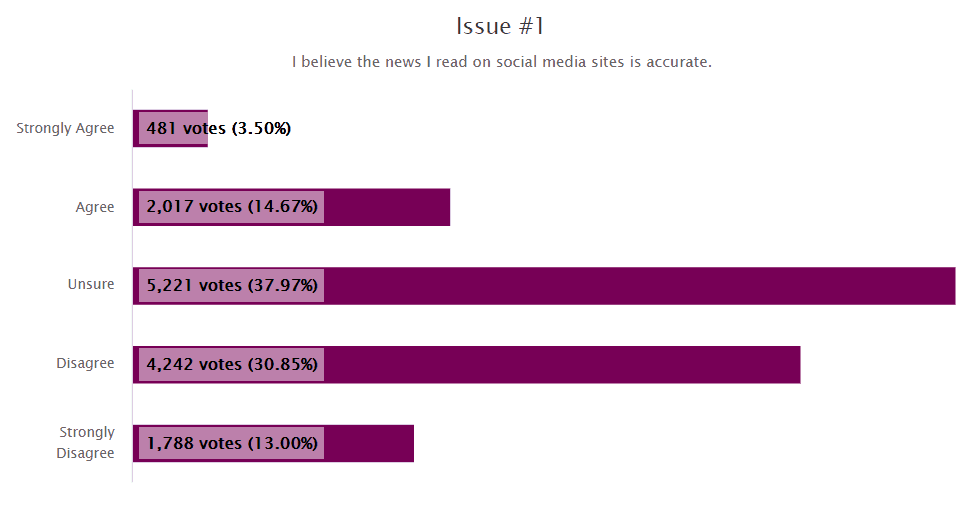
First Vote also includes a few issue-based questions every year. Interestingly, one of the issue-based questions asked students whether they agreed or disagreed with the statement, “I believe the news I read on social media sites is accurate,” and 44 percent either disagreed or strongly disagreed, with another 38 percent responding, “I don’t know.” These results demonstrate that while more students are primarily getting political news from social media, the majority of them are not confident that the news they get on social media is accurate.
To learn more about First Vote and see the results of the 2016 general election and 2017 local election, visit the First Vote website. First Vote will be back next year with the local election package, including lesson plans on local government and the importance of voting in local elections.
Weekly Insight Civic Engagement Voting & ElectionsAbout the author

Molly Osborne is the Director of Policy and Engagement for EducationNC and the N.C. Center for Public Policy Research.
Molly grew up in Essex, Massachusetts and attended the local public elementary, middle, and high school. She graduated from the University …
Read full bio »