College attainment is most broadly defined as the percentage of the adult population that holds a two- or four-year college degree. Organization for Economic Co-operation and Development’s (OECD) figures show that the college attainment rate of American adults ages 25-34 is only 42 percent, placing the United States 13th among other developed countries.1 Many notable statewide (for example, the University of North Carolina system and the North Carolina Community College System) systems and national (for example, the Lumina Foundation) organizations have identified increasing attainment rates as the single most important goal related to producing a workforce that is prepared to succeed in the jobs of the future. For this reason, this research focuses on raising attainment levels with a particular emphasis on underserved populations and offers various strategies that could impact college attainment across North Carolina.
|
Defining Key Terms College attainment rate — the percentage of the adult population that holds a two- or four-year college degree.1 College enrollment rate — the percentage of first-time college students who enroll at an accredited institution of higher learning.1 College completion rate — the percentage of individuals who complete a certificate or degree1 within 6 years.1 Sources: These are definitions commonly used in the context of college attainment. NCHEMS Information Center for Higher Education Policymaking and Analysis “Complete to Compete,” National Governors Association |
Numerous strategies exist to increase overall attainment levels, including tactics focused on plugging the pipeline in two distinct areas:
1.) between high school and college by raising college enrollment numbers, and
2.) in college by increasing college completion rates.
College enrollment and completion rates are inextricably linked to attainment rates; without seeing these two rates increase, it is very unlikely to see overall attainment rates increase either.
College enrollment,2 for the purpose of this report, is defined as the percentage of first-time college students who enroll at an accredited institution of higher learning. This term includes recent high school graduates as well as adults over the age of 18 who enroll in college several years after completing high school or earning a GED. Also included are military personnel and others who took a break for any reason between high school and college. Increasing enrollment in general requires a multi-pronged approach aimed at prospective students at varying stages of life and employment. Increasing enrollment of recent high school graduates by identifying ways to plug the educational pipeline between high school and college is a different approach than tactics used to attract working adults, for example.
College enrollment and completion rates are inextricably linked to attainment rates; without seeing these two rates increase, it is very unlikely to see overall attainment rates increase either.
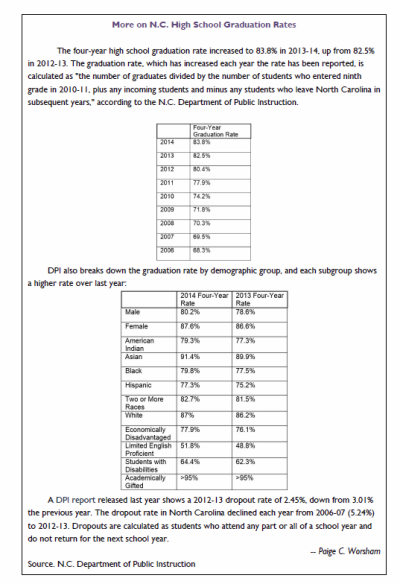
Between 2000 and 2010, enrollment in degree-granting institutions in the United States increased by 37 percent, from 15.3 million to 21.0 million.3 Much of the growth between 2000 and 2010 was in full-time enrollment; the number of full-time students rose 45 percent, while the number of part-time students rose 26 percent.4 However, a report released by the National Student Clearinghouse Research Center shows a 2.3 percent drop in college enrollment in the spring of 2013. Some suggest students are opting out of college due to an improving economy, allowing more students to return to gainful employment in the workforce.5 This may work in the short-term but long-term sustainability of success without post-secondary credentials is uncertain at best. In North Carolina, high school graduation rates have been slowly, yet steadily, rising. The 2014 four-year graduation rate for North Carolina public schools was 83.8 percent.6
 Increasing levels of college completion statewide would also result in greater attainment overall. College completion7 refers to a student earning a certificate or degree within six years of enrolling in college. Too many students drop out of college before earning a credential for a variety of reasons such as affordability, outside responsibilities, or lack of interest. These and other hurdles to completion must be addressed, particularly for underserved populations, in order to increase levels of attainment and ensure a prepared workforce and a strong economy.
Approximately 58 percent of first-time, full-time students in the U.S. who began seeking a bachelor’s degree at a 4-year institution in the fall of 2004 completed a bachelor’s degree at that institution within six years.
This is a slight increase from 1996, for example, when 55 percent of first-time, full-time students who began seeking a bachelor’s degree in the fall of 1996 earned a bachelor’s degree within 6 years at that institution.8
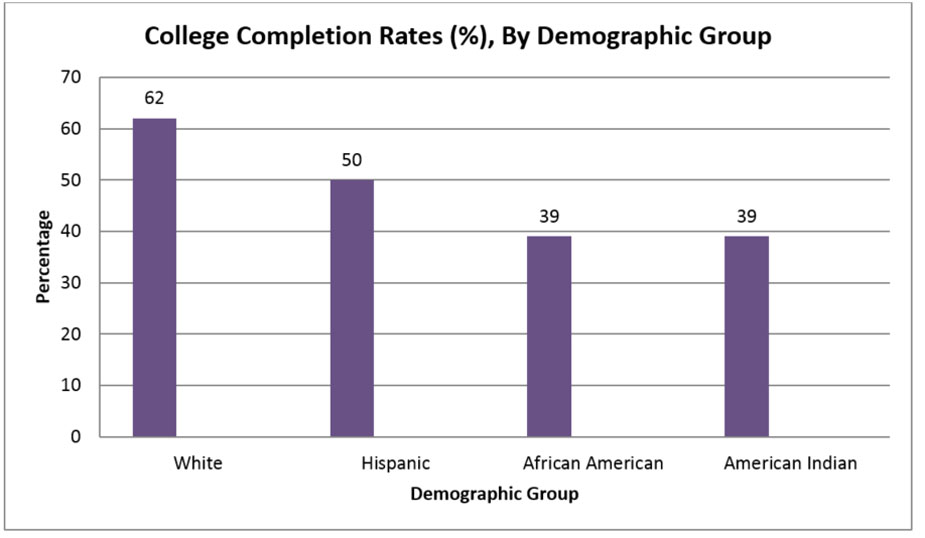
Recent data show nearly 58 percent of females seeking a bachelor’s degree at a public college graduated within 6 years, compared with 53 percent of males. Completion rates at public universities varied across racial and ethnic groups as well. For example, Asian and Pacific Islander students had the highest 6-year graduation rate (69 percent), followed by white students (62 percent), Hispanic students (50 percent), and African American and American Indian students (39 percent each).9 It is important to note, however, that these particular data on college graduation rates do not account for part-time students who represent 37 percent of all college students, 61 percent of public two-year college students and more than 40 percent of all black and Hispanic students.10 Nor do the numbers include data on transfer students, of whom 37 percent earned a bachelor’s degree through more than one institution and 23 percent through more than two institutions.11
To fully understand the scope of the attainment challenge and to identify meaningful strategies to address it, it is critical to disaggregate data on enrollment, completion, and overall attainment rates in order to highlight core demographic groups.
This report focuses primarily on presenting data on college attainment rates and offering sound strategies for increasing these rates among targeted demographic groups and geographies across the state. While the focus may be on attainment, increasing college enrollment and completion rates, as defined above, are both interconnected and critical to growing the overall percentage of adults in North Carolina with a post-secondary credential.
The Demographic and Geographic Divide
Without full participation in education by all North Carolinians, the state will suffer both economically and socially, with growing socio-economic disparities among population groups. Targeting particular groups that have traditionally suffered from low attainment rates will help raise the tide for the entire workforce, signaling a thriving economic engine. Increasing attainment rates for first-generation college students, minority students, and students from rural parts of the state has proven critically important but also a significant challenge. Many members of these groups fall into a broader category of adults who have received partial credit in higher education, but did not receive a credential. It would be reasonable to assume that targeting these adults, in particular, for reenrollment and completion would yield greater attainment rates with less in-depth outreach.
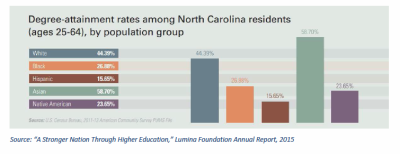
There is great variation in degree attainment rates among demographic groups in our state, which indicates a persistent need to focus efforts targeting particular minority groups with historically low attainment rates. For example, 44.4 percent of white adults (ages 25-64) in North Carolina have earned a post-secondary degree, compared to 26.9 percent of African American adults, 15.7 percent of Hispanic adults and 23.7 percent of American Indian adults.12 North Carolina falls below the national rates of degree attainment among whites (44.5 percent), African American (28.1 percent), Hispanics (20.3 percent), and American Indians (23.9 percent).13
A disturbing sign shows that the educational pipeline is losing minority students at a troubling rate. The U.S. high school graduation rate in 2010 was 87.6 percent for white students, 84.2 percent for African American students, and 62.9 percent for Hispanic students. While graduation rates have continued to rise over the last several decades, the real challenge is establishing proven methods of ensuring that these high school graduates go on to earn post-secondary credentials. Unfortunately, of these high school graduates in 2010, only 30.3 percent of white students, 19.8 percent of African American students and 13.9 percent of Hispanic students went on to earn 4-year college degrees.14
Another challenging wrinkle in the demographic data is the attainment distinction between men and women.
Overall, women have been increasing degree attainment levels, while their male counterparts’ levels have consistently remained lower. For example, in 2011, 45 percent of women (ages 25-64) held a two- or four-year degree, compared to 40 percent of men. This gap doubles when looking at women and men ages 25-29. Furthermore, the attainment rate for African American women, ages 25-34, (32 percent) is higher than that of African American men (28 percent), as is the rate for Hispanic women of the same age range (24 percent) and men (16 percent).15
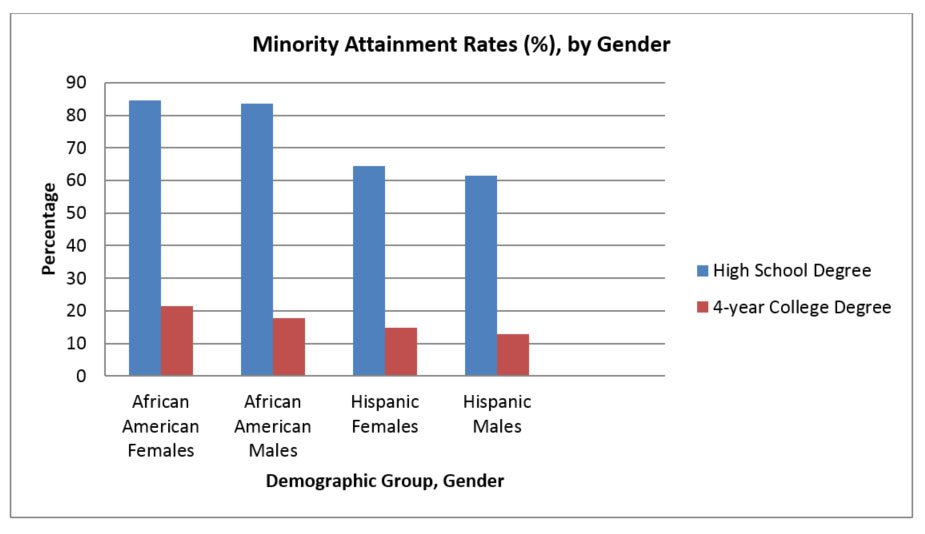
When breaking down these numbers by gender, it becomes apparent that both African American and Hispanic males fall short of their female counterparts, both in terms of graduating from high school and also in terms of earning a 4-year college degree. While 84.6 percent and 64.4 percent of African American and Hispanic females, respectively, graduate from high school, only 83.6 percent and 61.4 percent of males graduate from high school, respectively.16 When examining those who earned a 4-year college degree, females again have higher rates of degree completion, with 17.7 percent of African American males, compared to 21.4 percent of females earning a degree, and 12.9 percent of Hispanic males, compared to 14.9 percent of females.17
Exacerbating the challenge of increasing attainment rates among these particular population groups is a lack of access to higher education in the state’s most rural counties.
Educational attainment levels in rural counties are, on average, considerably lower than the state’s more urban counties. In North Carolina, 27 of the state’s 100 counties have an attainment rate (defined in this case as at least an associate’s degree) of 25 percent or lower, with seven holding a rate below 20 percent. This is compared to an average attainment rate of 48.3 percent18 for the state’s four most populous counties (Mecklenburg, Wake, Guilford, Forsyth). Furthermore, many rural counties have minority populations that fall above the state average, highlighting the challenge of increasing attainment levels for minority groups in particular. For example, in Tyrrell County in eastern North Carolina, 14.4 percent of the adult population has at least an associate degree, the lowest rate in the state.19 According to Census data, Tyrrell County’s population is 36.6 percent African American, more than 14 percentage points higher than the statewide African American population as a whole.20
First-generation college students, those whose parents did not attend college, are even less likely to earn a degree themselves, either by never enrolling in college or by dropping out. Most first-generation college students are low-income minorities or from rural parts of the state where access to higher education is limited. A 2010 study by the U.S. Department of Education found that 50 percent of the college population is made up of first-generation students, or those whose parents did not receive education beyond a high school diploma.21 These numbers can be further broken down by the educational levels of parents of current college attendees. Minority groups made up the largest groups of students with parents with a high school education or less, with 48.5 percent of Hispanic students and 45 percent of African American students. Thirty-five percent of parents of American Indian students had a high school diploma or less. Of students who identified themselves as Caucasian, only 28 percent were first-generation college students.22
If first-generation students earn bachelor’s or associate’s degrees, they go on to earn comparable salaries and are employed in similar occupations as their non-first-generation peers.
There are certain characteristics that distinguish first-generation students. For example, they are more likely to be older, have lower incomes, be married, have dependents and attend part-time, when compared to their non-first-generation peers. Finally, and most notable, is the finding that first-generation students at both 2-year and 4-year institutions succeed in post-secondary education at lower rates than their non-first-generation counterparts. However, if first-generation students earn bachelor’s or associate’s degrees, they go on to earn comparable salaries and are employed in similar occupations as their non-first-generation peers, suggesting that earning a degree, not simply enrolling in college, is the most likely way to break down barriers to success for first-generation students.23
According to UNC system enrollment numbers, in the fall of 2011, 61.5 percent of students were white, 21.5 percent were African American, 4.1 percent were Hispanic and 1 percent of students were American Indian.24 According to 2012 Census data, general demographic make-up of the state at that time was 71 percent white, 22 percent African American, 8.7 percent Hispanic and 1.5 percent American Indian.25 While UNC system enrollment numbers somewhat reflect the statewide demography, a significant push is needed to enroll and graduate African American students, who traditionally have low attainment numbers and Hispanic students, who also have low attainment numbers and comprise the fastest growing population in the state. The impact on our economy of the fastest growing population also being the most undereducated would lead to significant imbalance, given that there simply are not sufficient low-skill jobs in our current economy to support the influx of low-skill workers. This would result in high unemployment and increased state and federal spending on social services. Furthermore, because people with greater educational attainment earn more over the course of their lives, the educational discrepancies among various groups would extend income and social inequalities.
Looking Ahead
The chapters ahead focus primarily on college attainment rates, which are widely believed to be among the most important indicators of educational and economic strength, and strategies currently underway aiming to increase these rates among targeted demographic groups and geographies across the state. Not only will a focus on increased college attainment allow North Carolina’s economy to thrive, but such a commitment will also begin to address many societal inequities among different demographic groups and across our state’s varied geographies. Through post-secondary attainment for all North Carolinians, the state can harness our collective human capital to ensure our state’s continued economic competitiveness.
Introduction Part One Part Two Part Three
Promising Programs Statewide: Fayetteville State University
Promising Programs Statewide: Elizabeth City State University
Promising Programs Statewide: College of The Albemarle
Promising Programs Statewide: Asheville-Buncombe Technical Community College
Promising Programs Statewide: Bladen Community College
Snapshot: Veteran and Military Students
Promising Programs Statewide: UNC-Greensboro
Promising Programs Statewide: Bennett College
Promising Programs Statewide: University of North Carolina at Charlotte
Promising Programs Statewide: University of North Carolina at Pembroke
Michelle Goryn is a writer and public policy consultant in Raleigh, NC.
Paige C. Worsham is Senior Policy Counsel with the North Carolina Center for Public Policy Research and conducted the interviews and convenings for this project.
The N.C. Center for Public Policy Research is grateful to numerous, generous supporters. Major funding for this project is provided by the Lumina Foundation for Education, with additional funding from the James G. Hanes Memorial Fund, and the Hillsdale Fund.
- “A Stronger Nation through Higher Education,” Lumina Foundation Annual Report, 2015, http://strongernation.luminafoundation.org/report/#north-carolina. ↩
- “College enrollment” is used interchangeably throughout this report with “college going” and “college participation.” ↩
- National Center for Education Statistics, http://nces.ed.gov/fastfacts/display.asp?id=98. ↩
- Ibid. ↩
- “Fewer U.S. Graduates Opt for College After High School,” The New York Times, Apr. 25, 2014, http://www.nytimes.com/2014/04/26/business/fewer-us-high-school-graduates-opt-for-college.html?_r=0. ↩
- N.C. Department of Public Instruction, 2014 North Carolina Cohort Graduation Rate, http://www.ncpublicschools.org/docs/accountability/reporting/1314cohortgradrate.pdf. ↩
- “College completion rates” is used interchangeably with “college graduation rates” in this report. ↩
- National Center for Education Statistics, Fast Facts, http://nces.ed.gov/fastfacts/display.asp?id=40. ↩
- Ibid. ↩
- “Complete to Compete;” 2010 report from the National Governors Association, http://www.nga.org/files/live/sites/NGA/files/pdf/1007COMMONCOLLEGEMETRICS.PDF. ↩
- Ibid. The U.S. Department of Education’s National Center for Education Statistics tracks first-time, full-time undergraduate students in its database (IPEDS). Additional methods of measuring college attainment use different criteria. For example, the National Student Clearinghouse tracks students that transfer institutions. ↩
- “A Stronger Nation through Higher Education,” Lumina Foundation Annual Report, 2015, http://strongernation.luminafoundation.org/report/#north-carolina. ↩
- Ibid. ↩
- U.S. Census Bureau, http://www.census.gov/compendia/statab/2012/tables/12s0230.pdf. ↩
- “A Stronger Nation through Higher Education,” Lumina Foundation Annual Report, 2013, see above. ↩
- U.S. Census Bureau, http://www.census.gov/compendia/statab/2012/tables/12s0230.pdf. ↩
- Ibid. ↩
- “A Stronger Nation through Higher Education,” Lumina Foundation Annual Report, 2015, http://strongernation.luminafoundation.org/report/#north-carolina. ↩
- Ibid. ↩
- U.S. Census Bureau, http://quickfacts.census.gov/qfd/states/37/37177.html. ↩
- U.S. Department of Education, Profile of Undergraduate Students 2007-2008, published September 2010, http://nces.ed.gov/pubs2010/2010205.pdf. ↩
- Ibid. ↩
- First-Generation Students: Undergraduates Whose Parents Never Enrolled in Post-secondary Education; NCES Statistical Report, June 1998, http://nces.ed.gov/pubs98/98082.pdf. ↩
- “Our Time, Our Future,” The UNC Compact with North Carolina, Strategic Directions Initiative, 2013-2018, https://www.northcarolina.edu/?q=content/our-time-our-future. ↩
- U.S. Census Bureau http://quickfacts.census.gov/qfd/states/37000.html. ↩


